Japanese Candlesticks Analysis 19.03.2020 (GOLD, NZDUSD, GBPUSD)
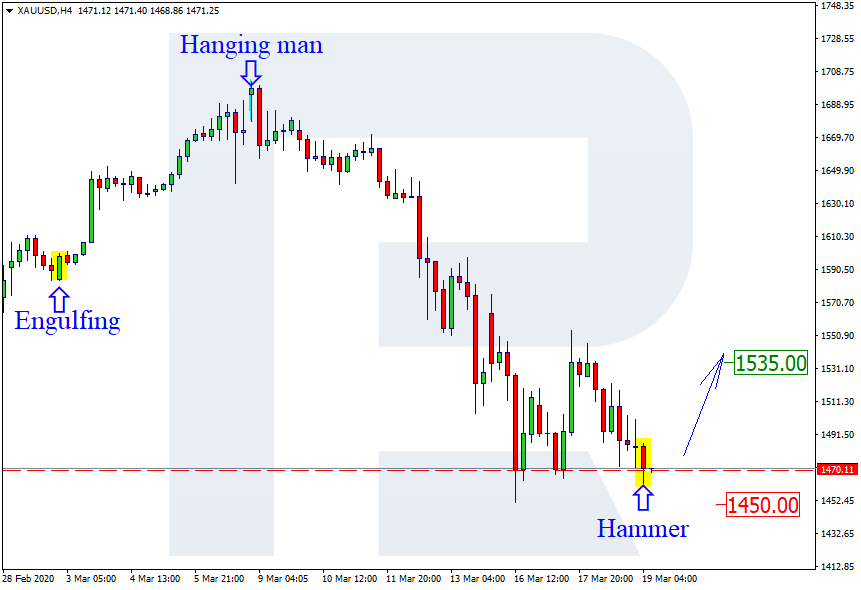
XAUUSD, “Gold vs US Dollar”
As we can see in the H4 chart, Gold is testing the support level. By now, it has formed several reversal patterns, such as Hammer. Possibly, the pair may reverse and start a new correction to reach 1535.00. However, one shouldn’t ignore another scenario, according to which the instrument may continue falling without any significant pullbacks. In this case, the downside target may be at 1450.00.

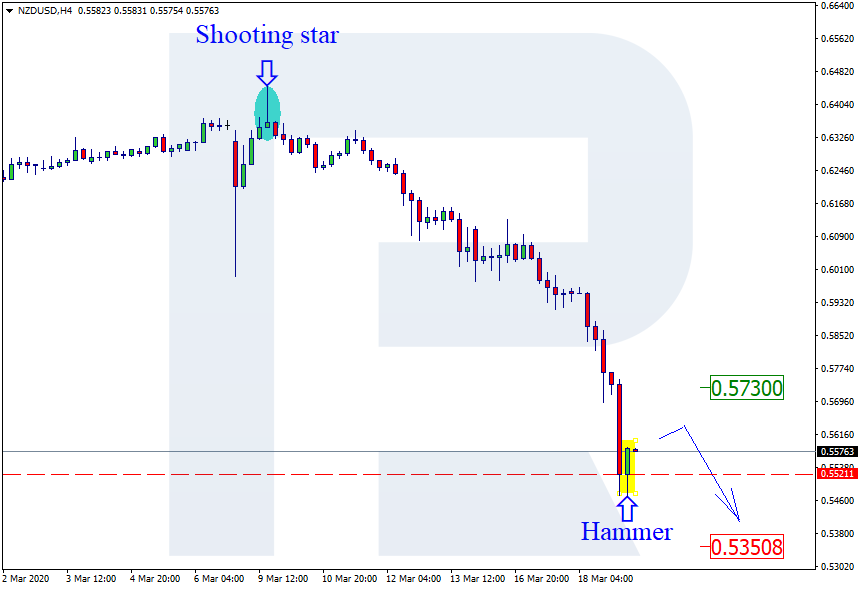
NZDUSD, “New Zealand vs. US Dollar”
As we can see in the H4 chart, after breaking the descending channel and forming a Hammer reversal pattern not far from the support level, NZDUSD is expected to reverse and get back to 0.5730. Later, the price may resume trading downwards. At the same time, one shouldn’t exclude an opposite scenario, according to which the instrument may fall towards 0.5350 without forming any serious corrections.
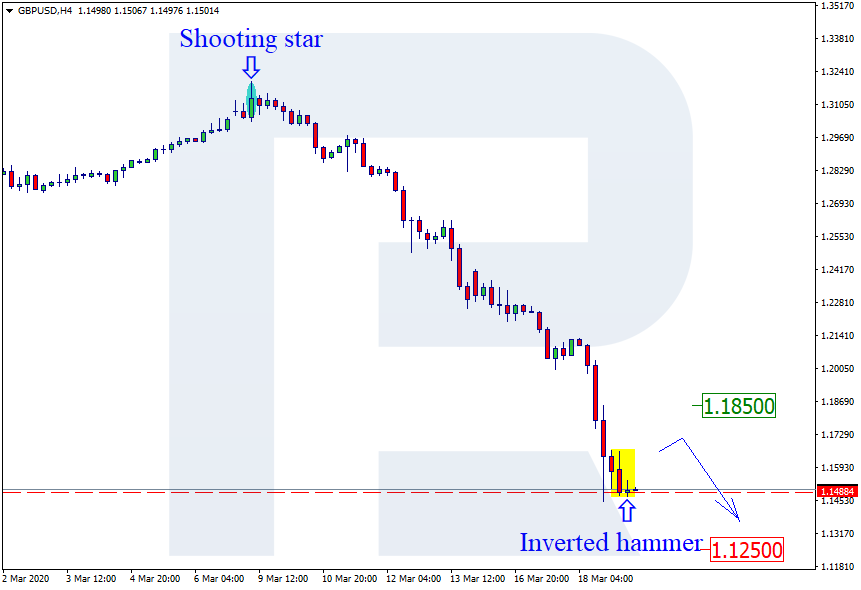
GBPUSD, “Great Britain Pound vs US Dollar”
As we can see in the H4 chart, the pair is no longer trading inside the descending channel. By now, GBPUSD has formed another Inverted Hammer reversal pattern close to the support level. Possibly, the pair may reverse and get back to 1.1850. Later, the market may continue the descending tendency. However, there is another scenario, which implies that the instrument may fall towards 1.1250 without reversing.
Forecasts presented in this section only reflect the author’s private opinion and should not be considered as guidance for trading. RoboForex bears no responsibility for trading results based on trading recommendations described in these analytical reviews.