Fibonacci Retracements Analysis 03.02.2020 (GOLD, USDCHF)
XAUUSD, “Gold vs US Dollar”
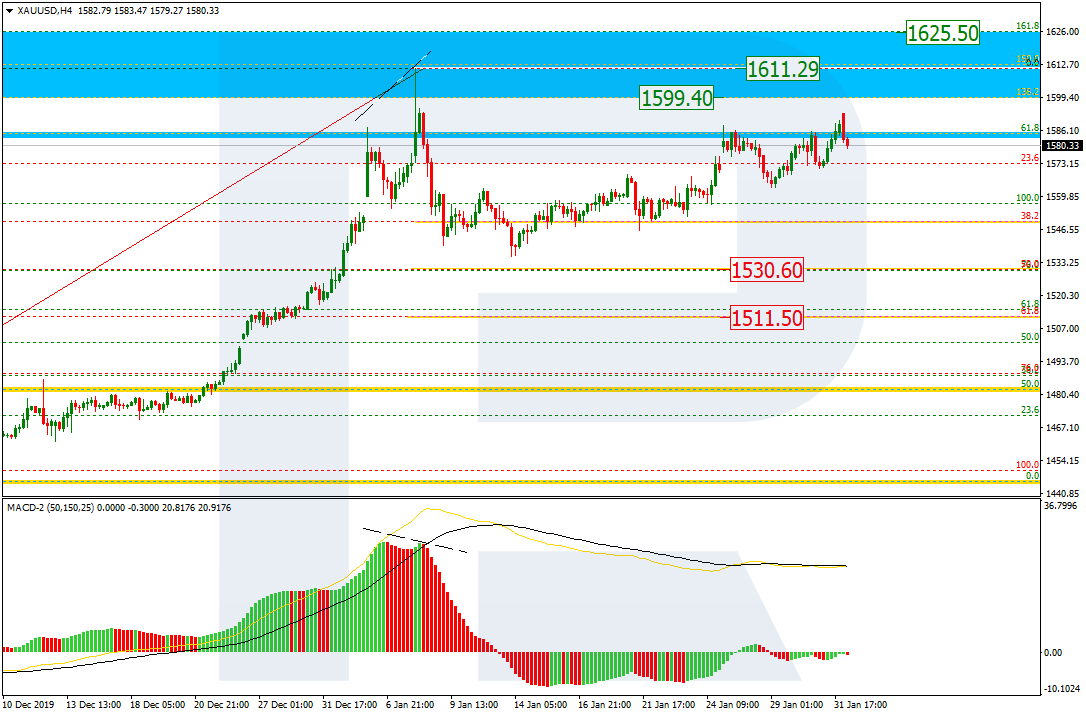
As we can see in the H4 chart, XAUUSD continues forming the rising wave towards the current high at 1611.29 and then the post-correctional extension area between 138.2 and 161.8% fibo at 1599.45 and 1625.70 respectively. However, after reaching the high, the price may rebound from it and start a new decline towards 50.0% and 61.8% fibo at 1530.60 and 1511.80 respectively.

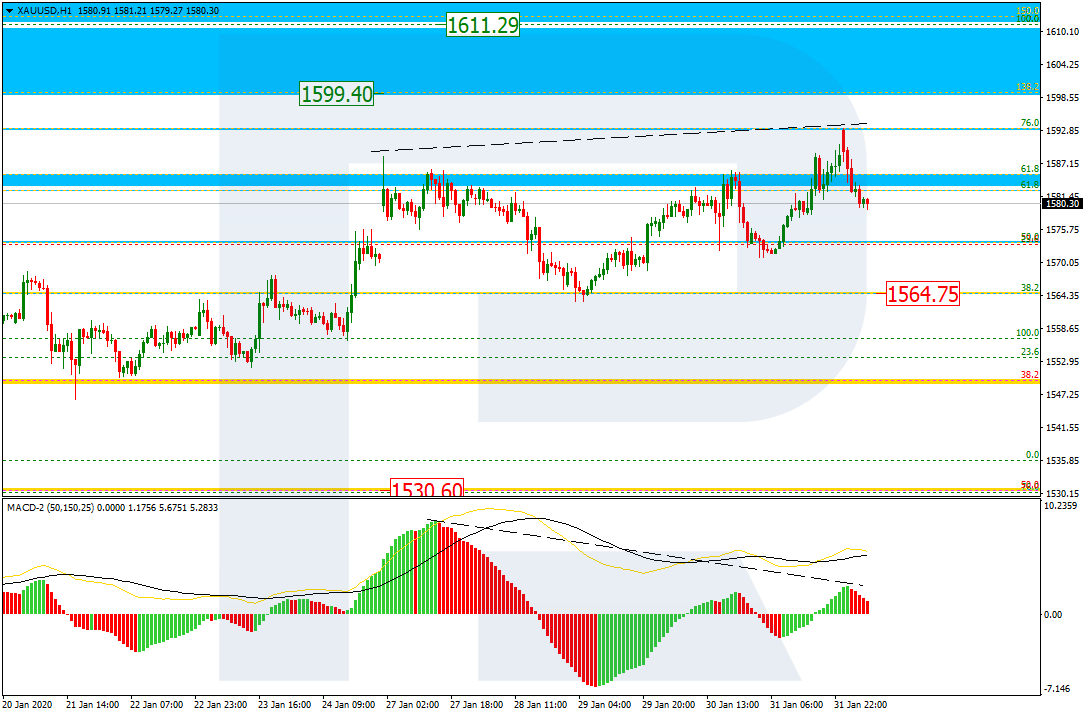
In the H1 chart, the pair has reached 76.0% fibo. At the same time, there is a divergence on MACD, which indicates a new pullback to the downside. The target is the local support at 38.2% fibo (1564.75).
USDCHF, “US Dollar vs Swiss Franc”
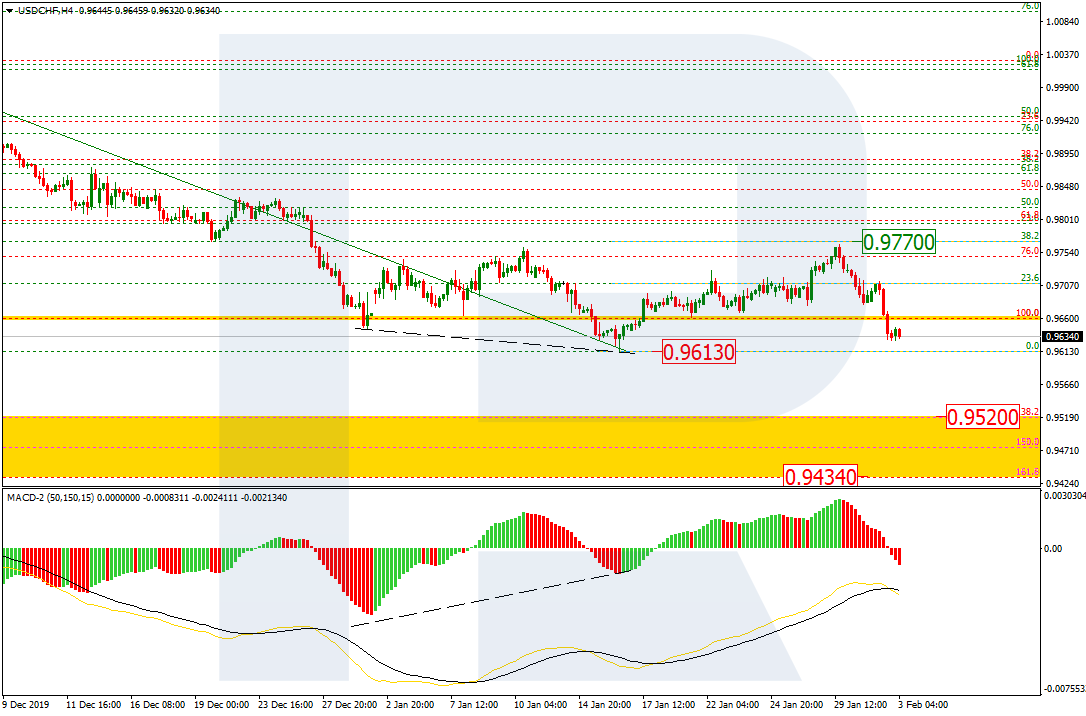
As we can see in the H4 chart, the correctional uptrend has reached 38.2% fibo at 0.9770; right now, the price is forming a new descending impulse towards the low at 0.9613. Later, the market may break the low and continue falling towards the post-correctional extension area between 138.2 and 161.8% fibo at 0.9520 and 0.9343 respectively.
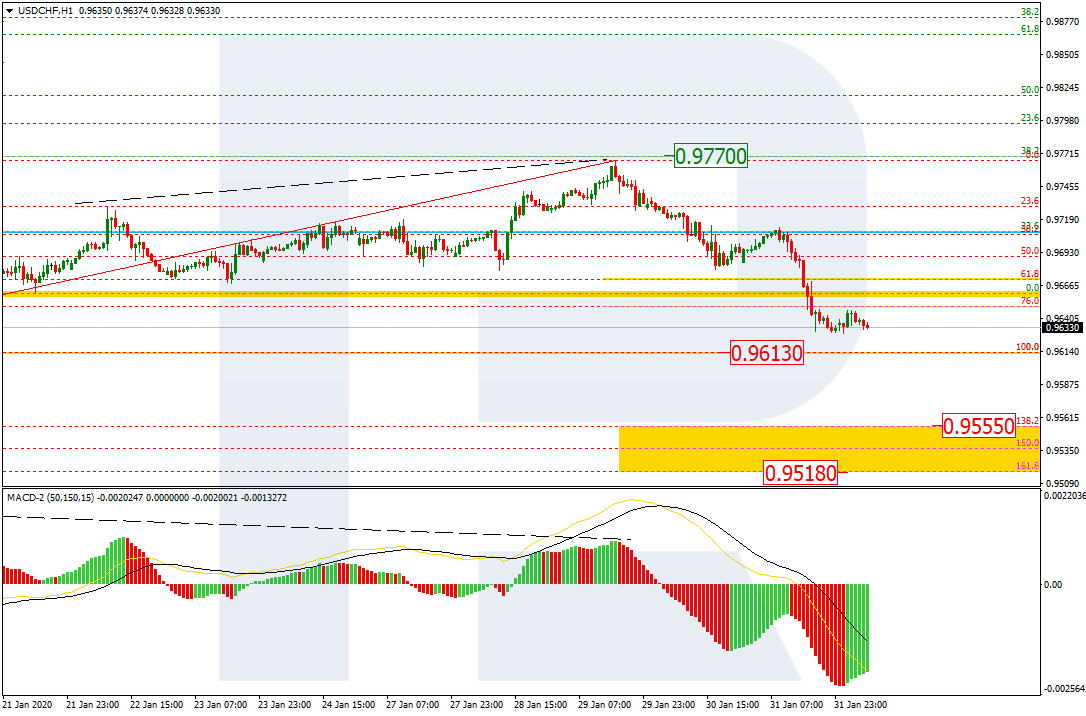
In the H1 chart, USDCHF may break the low and then continue trading downwards to reach its short-term targets, which are inside the post-correctional extension area between 138.2 and 161.8% fibo at 0.9555 and 0.9518 respectively.
Forecasts presented in this section only reflect the author’s private opinion and should not be considered as guidance for trading. RoboForex bears no responsibility for trading results based on trading recommendations described in these analytical reviews.