Fibonacci Retracements Analysis 23.01.2020 (AUDUSD, USDCAD)
AUDUSD, “Australian Dollar vs US Dollar”
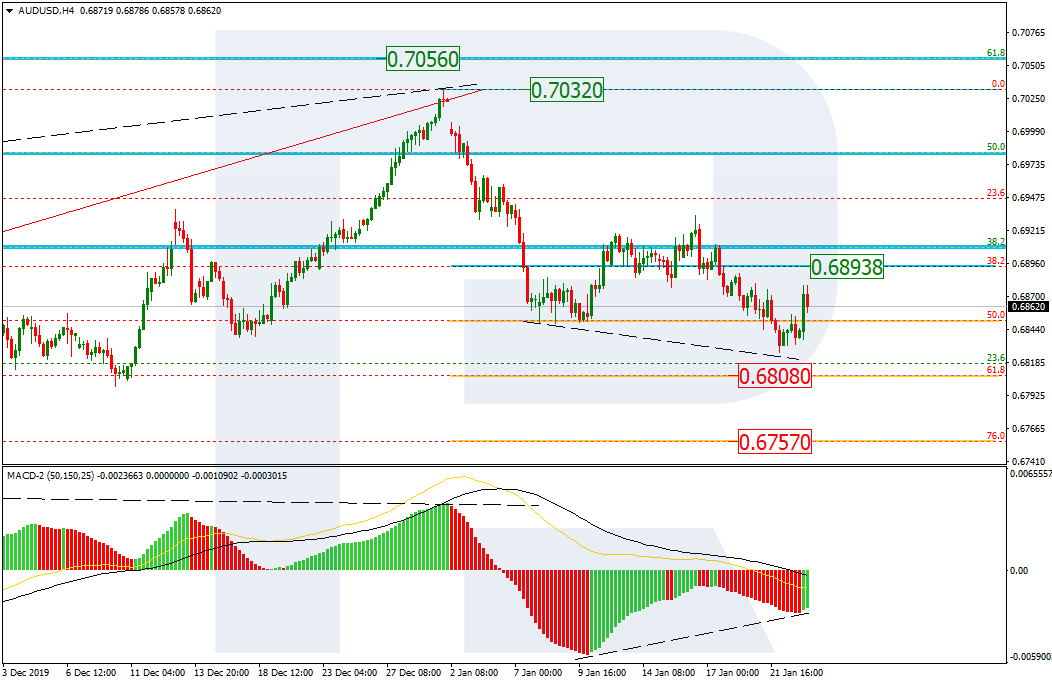
As we can see in the H4 chart, the convergence made the pair complete the downtrend, which failed to reach 61.8% fibo at 0.6808, and start a new growth. However, despite the convergence and the current growth, it’s too early to suggest a reverse. To start a proper trend reverse, the price must break the resistance at 38.2% fibo (0.6893). In this case, the upside target will be the high at 0.7032.

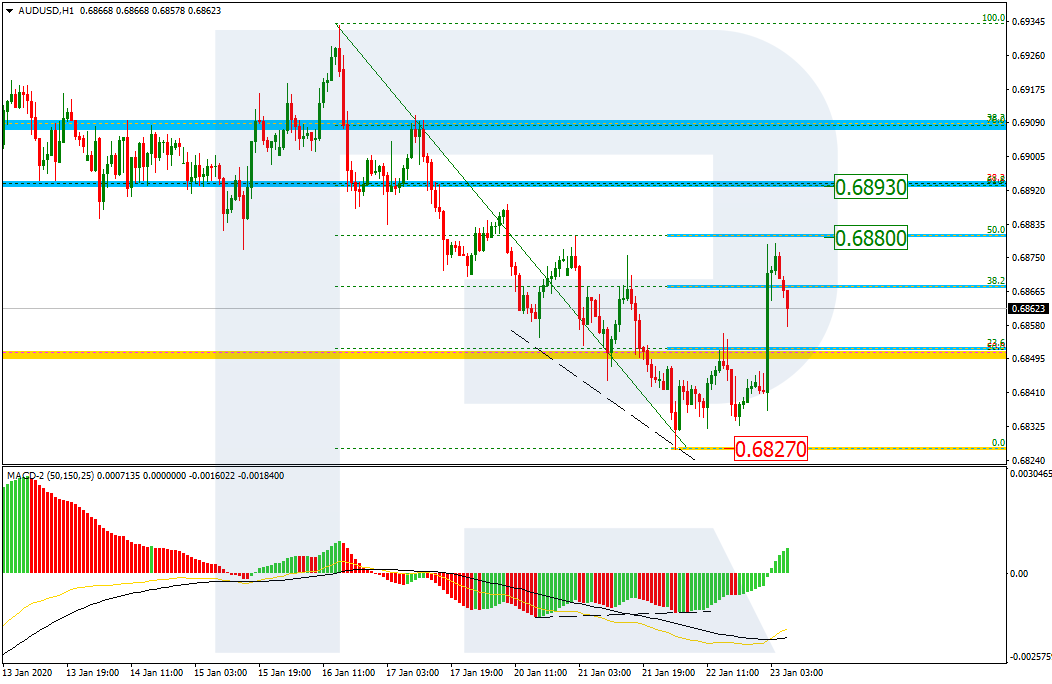
The H1 chart shows more detailed structure of the current rising correction. By now, the pair has reached 38.2% fibo and may continue growing towards 50.0% and 61.8% fibo at 0.6880 and 0.6893 in the nearest future. The correction will be over after the instrument breaks the local support at 0.6827.
USDCAD, “US Dollar vs Canadian Dollar”
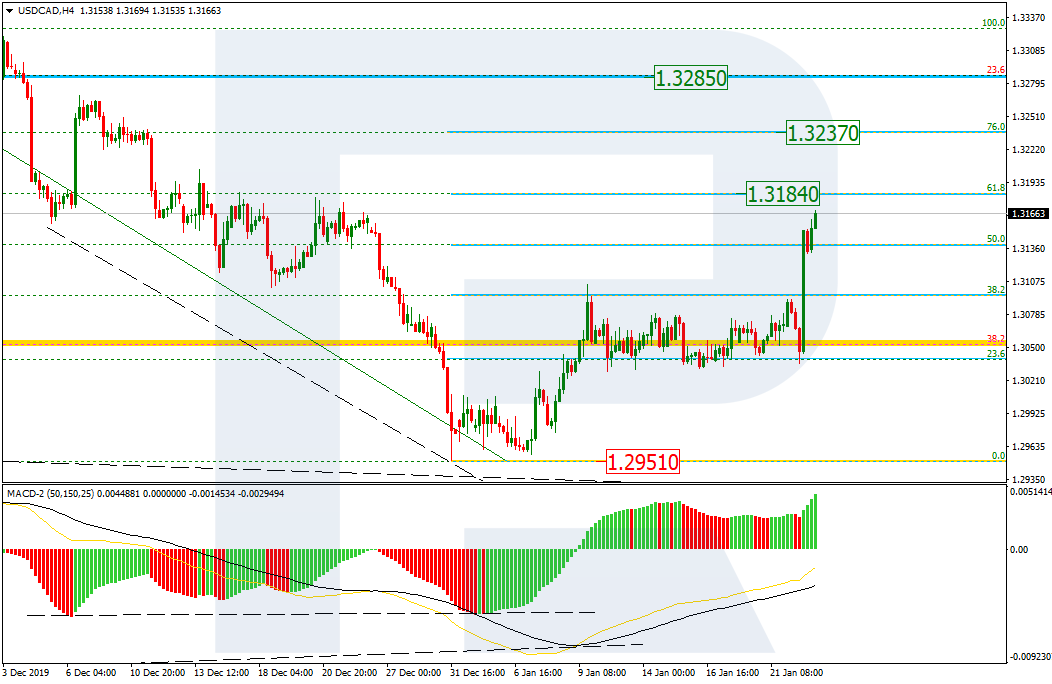
As we can see in the H4 chart, USDCAD is skyrocketing after completing its long sideways movement. The current rising impulse continues the correction after the descending wave and the convergence, by now, it has already reached 50.0% fibo and may later continue towards 61.8% and 76.0% fibo at 1.3184 and 1.3237 respectively. The support is the low at 1.2951.
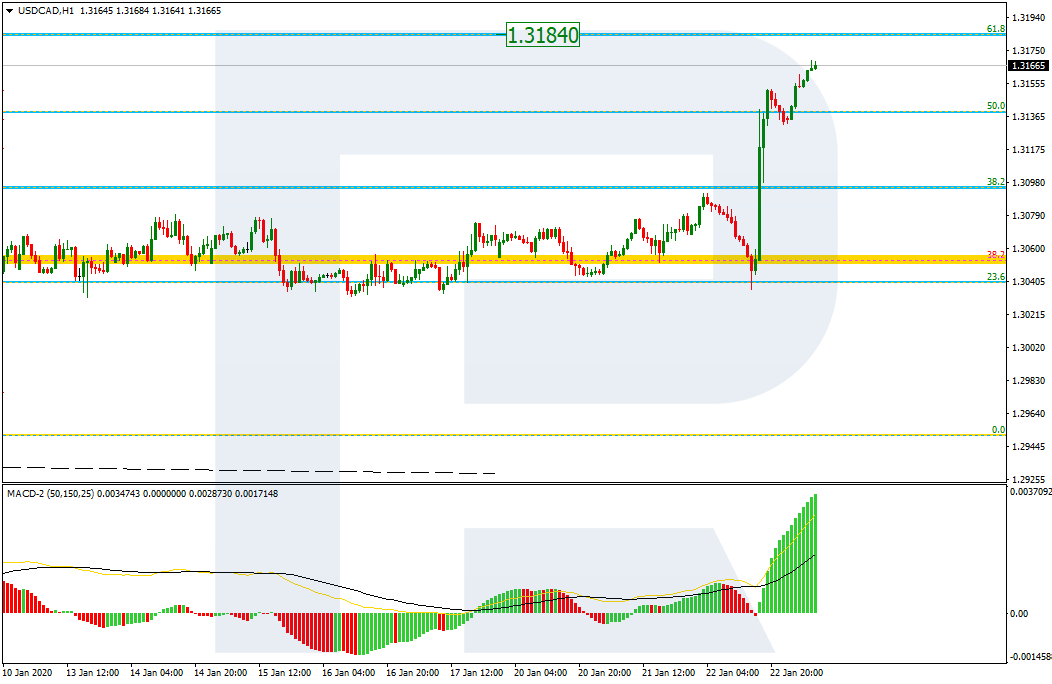
In the H1 chart, the pair is heading towards 61.8% fibo at 1.3184.
Forecasts presented in this section only reflect the author’s private opinion and should not be considered as guidance for trading. RoboForex bears no responsibility for trading results based on trading recommendations described in these analytical reviews.