Fibonacci Retracements Analysis 21.01.2021 (AUDUSD, USDCAD)
AUDUSD, “Australian Dollar vs US Dollar”
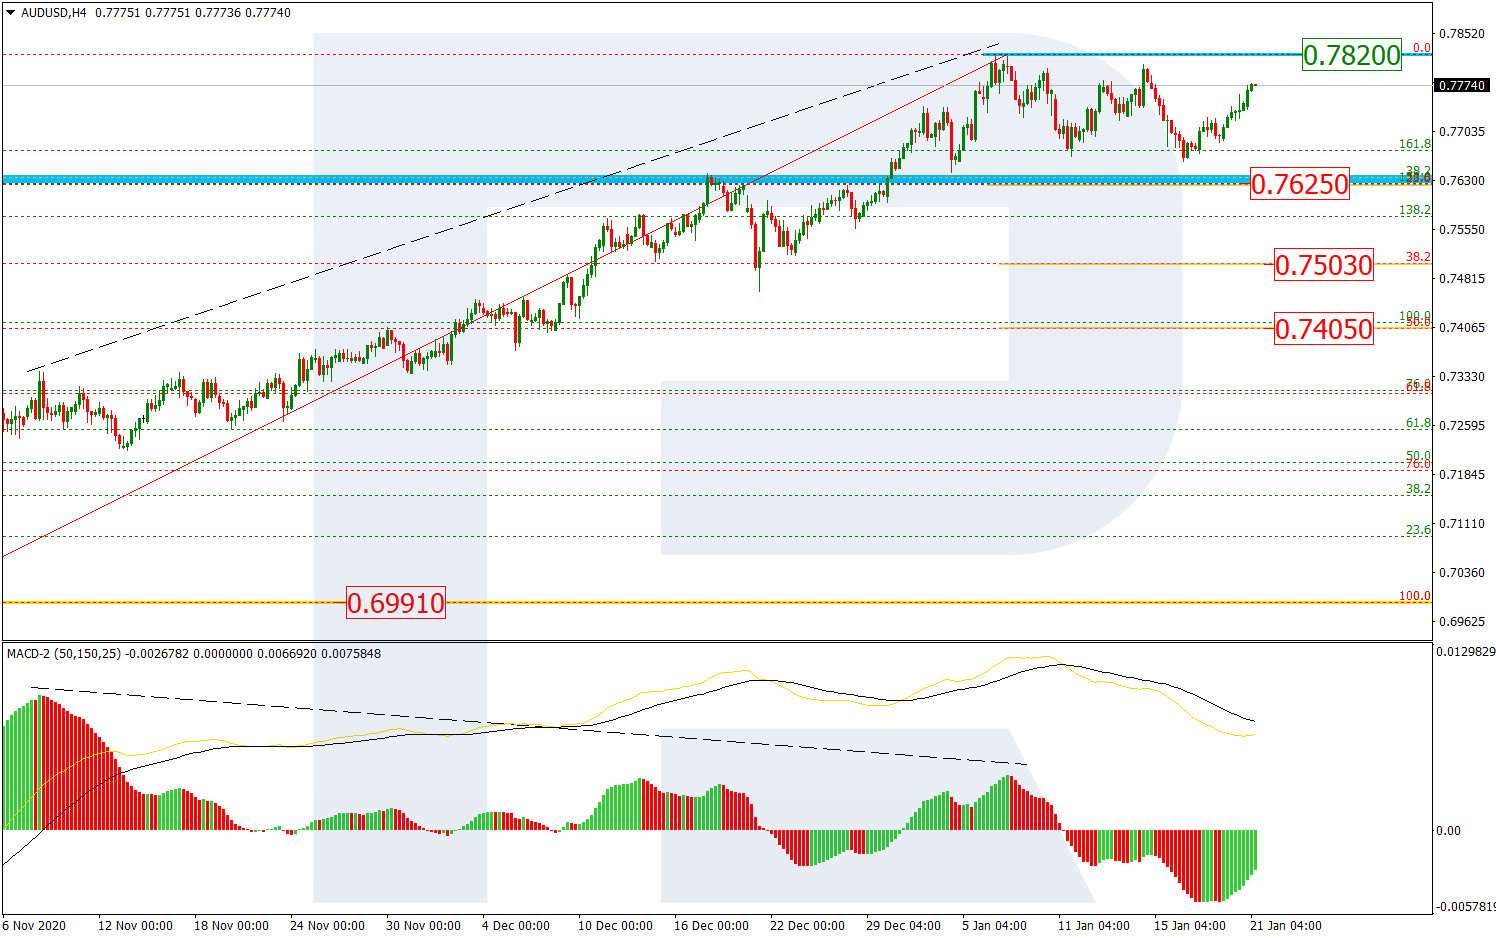
As we can see in the H4 chart, AUDUSD is forming a new local correction after a divergence on MACD. The current rising impulse is heading towards the high at 0.7820, a breakout of which will lead to a further growth to reach the long-term 50.0% fibo at 0.8292. However, if the price rebounds from the high, the asset may resume falling to reach 23.6%, 38.2%, and 50.0% fibo at 0.7625, 0.7503, and 0.7405 respectively.

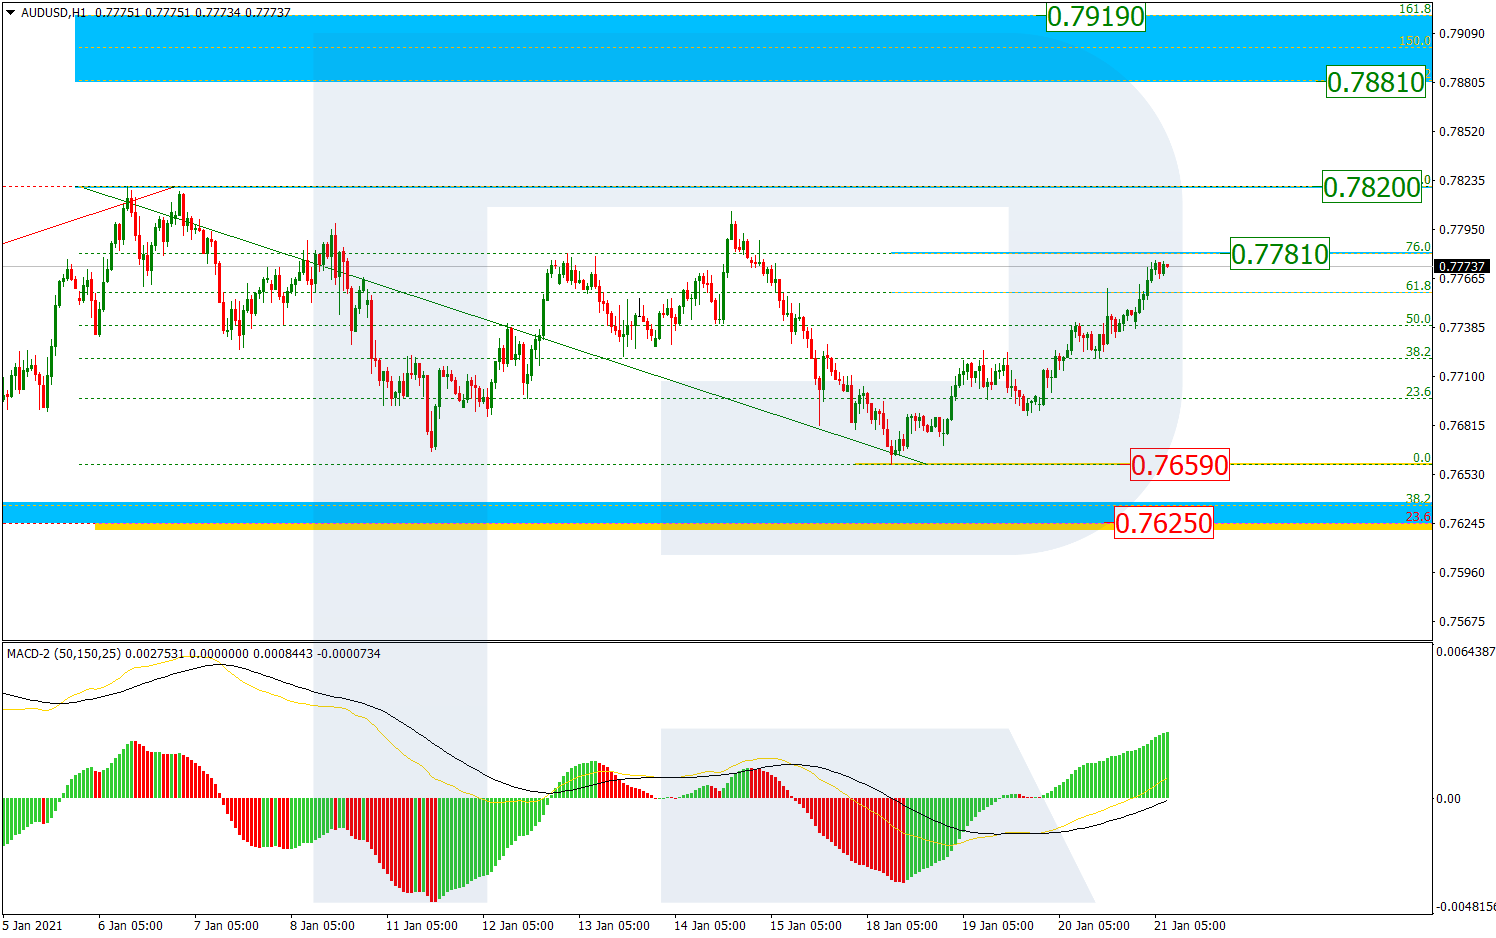
The H1 chart shows that the current ascending movement has already broken 61.8% fibo and is getting close to 76.0% fibo at 0.7781. If the price grows and breaks the high, the asset may continue trading upwards to reach the post-correctional extension area between 138.2% and 161.8% fibo at 0.7881 and 0.7919 respectively. The support is at 0.7659, a breakout of which may hint at a new mid-term decline.
USDCAD, “US Dollar vs Canadian Dollar”
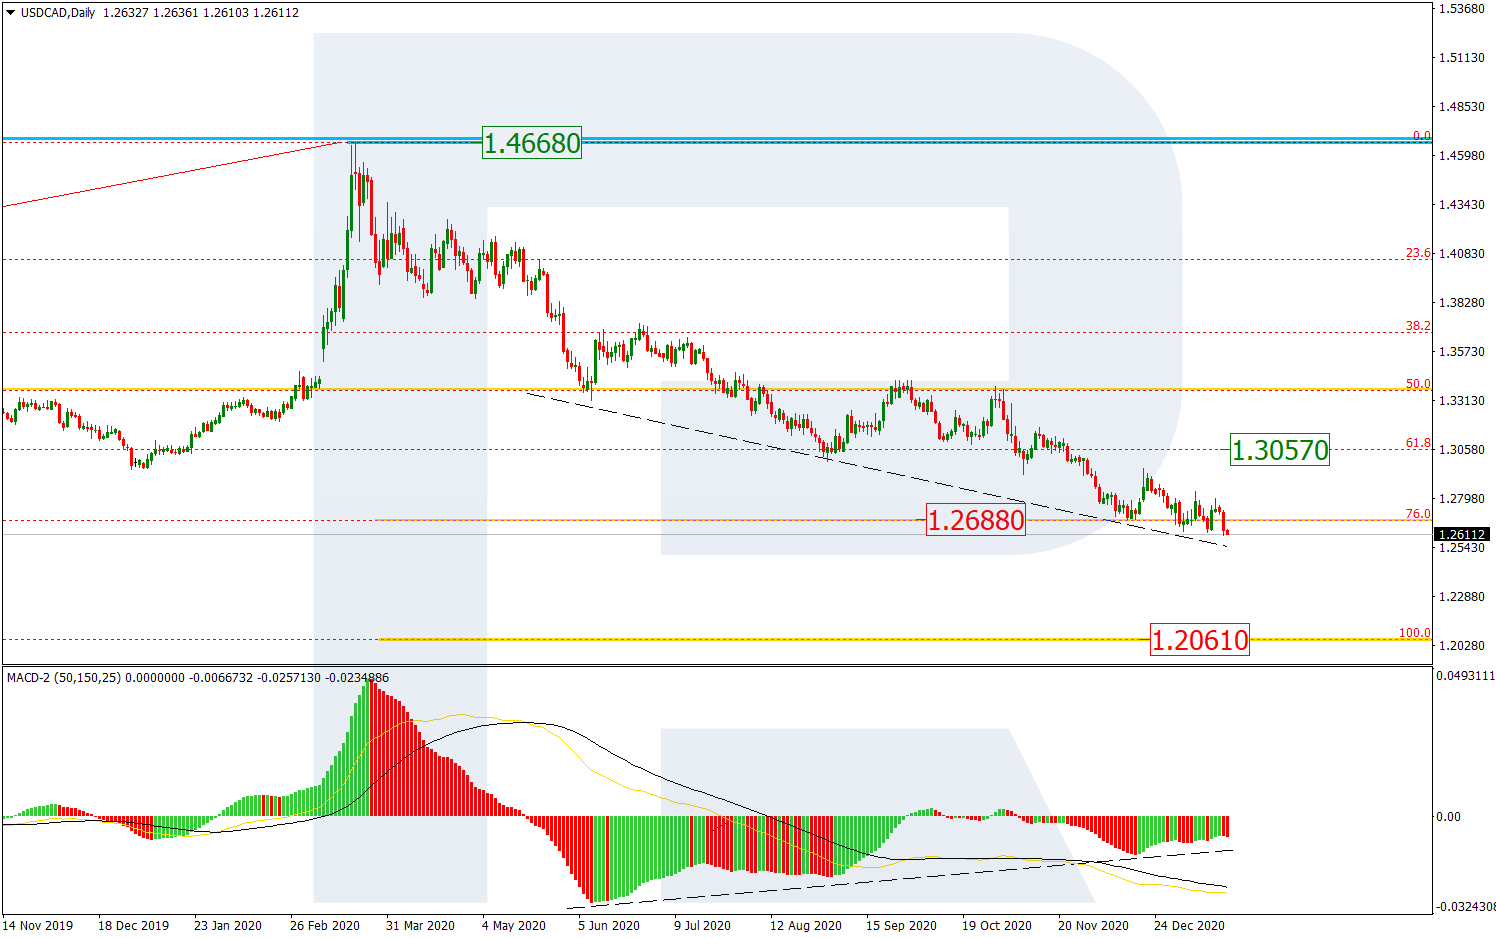
As we can see in the daily chart, after a thorough test of 76.0% fibo, USDCAD is breaking this level. In this case, the next downside target may be close to the fractal low at 1.2061. At the same time, there is a convergence on MACD, which may hint at a new pullback towards the resistance at 61.8% fibo (1.3057).
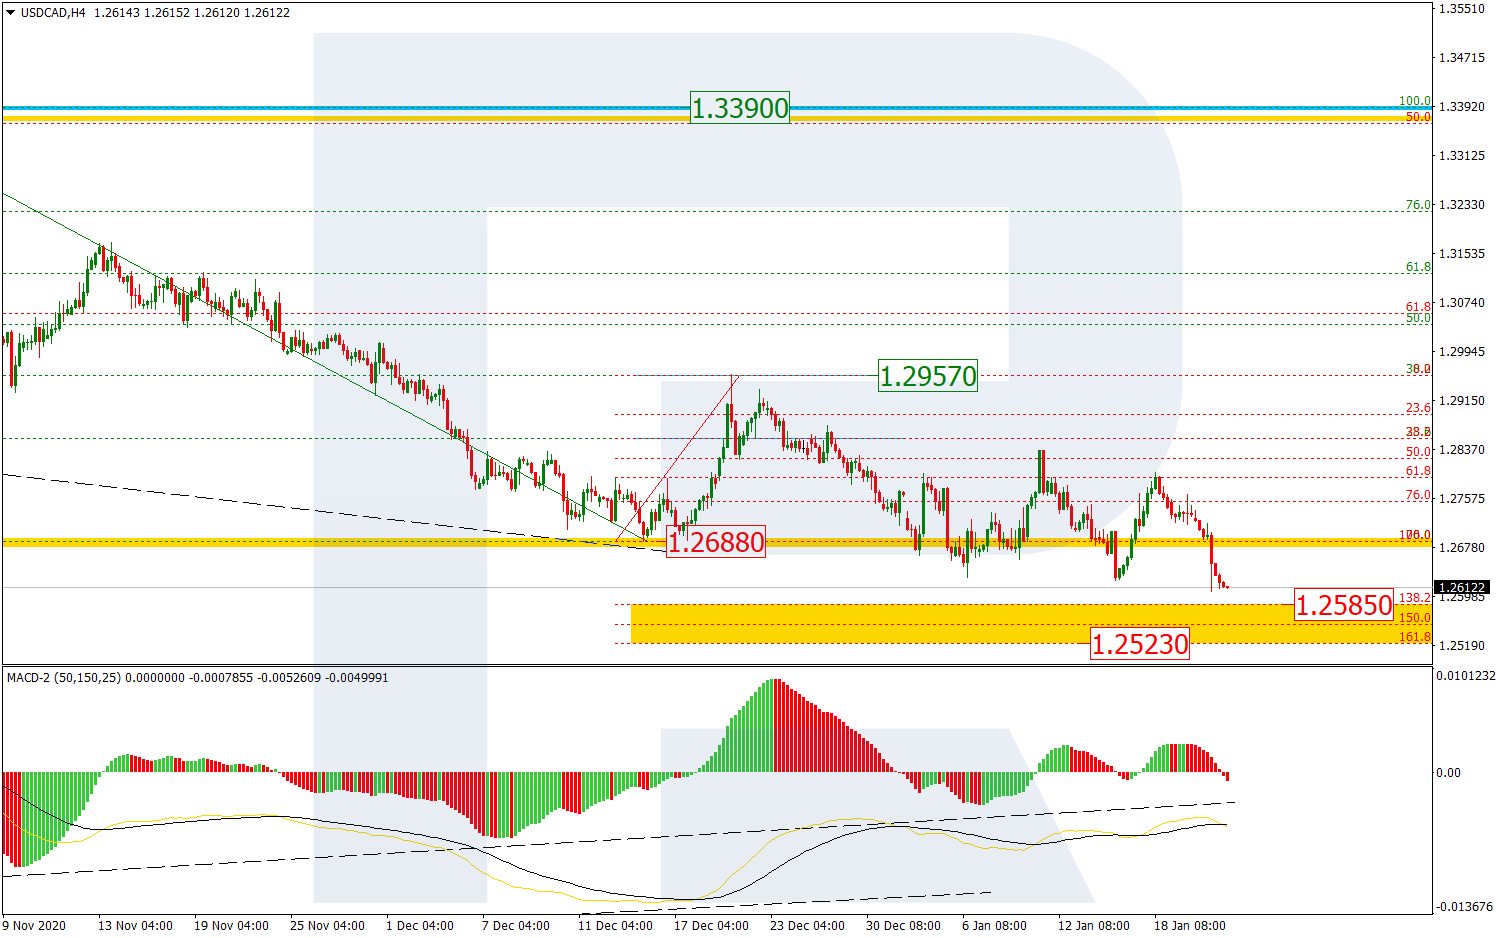
In the H4 chart, after breaking the low at 1.2688, the pair is falling towards the local post-correctional extension area between 138.2% and 161.8% fibo at 1.2585 and 1.2523 respectively. The local resistance is at 1.2957.
Forecasts presented in this section only reflect the author’s private opinion and should not be considered as guidance for trading. RoboForex bears no responsibility for trading results based on trading recommendations described in these analytical reviews.