Fibonacci Retracements Analysis 23.09.2021 (Brent, Dow Jones)
Brent
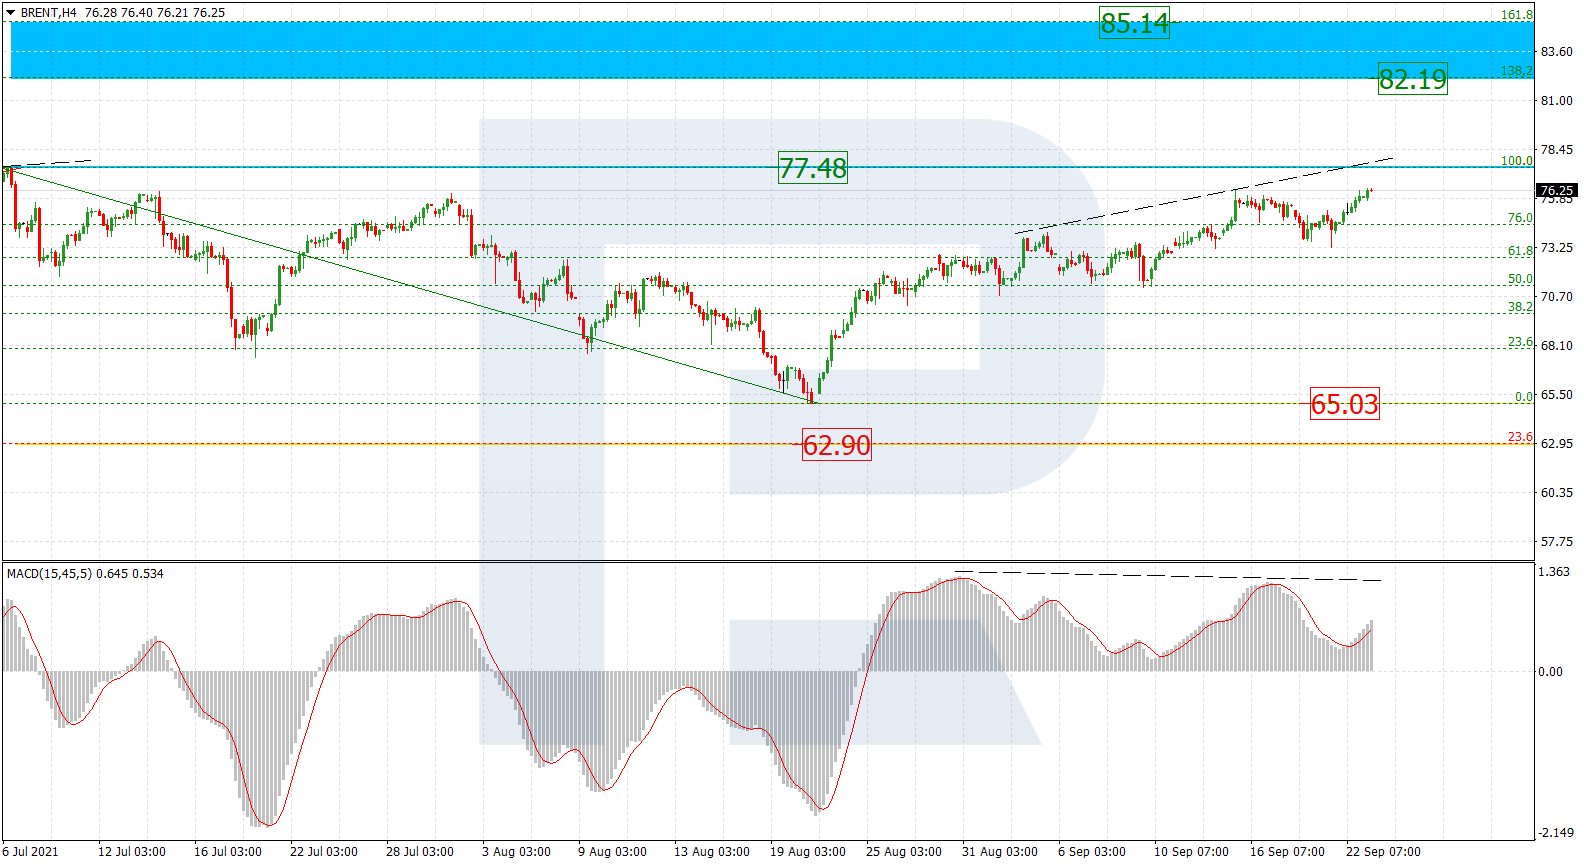
As we can see in the H4 chart, the current rising wave has broken 76.0% fibo and is approaching the high at 77.48, a breakout of which may lead to a further uptrend towards the post-correctional extension area between 138.2% and 161.8% fibo at 82.21 and 85.14 respectively. the key support here is the local low at 65.03. At the same time, there might be divergence on MACD to indicate a possible pullback after the price test the high.

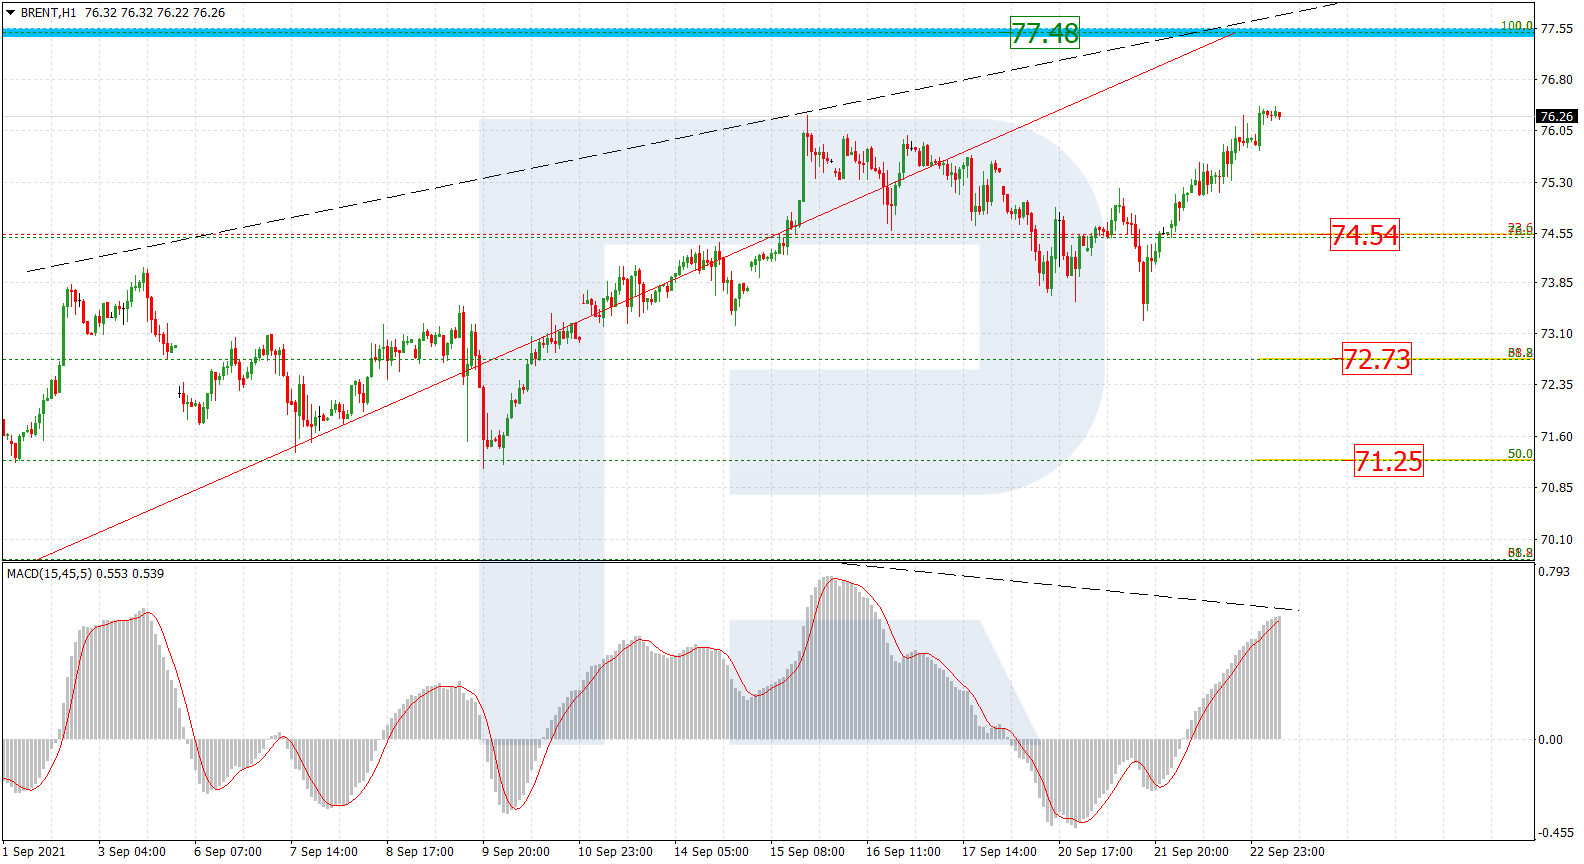
In the H1 chart, the asset may start a new correctional downtrend after testing the high. The potential downside targets are 23.6%, 38.2%, and 50.0% fibo at 74.54, 72.73, and 71.25 respectively.
Dow Jones
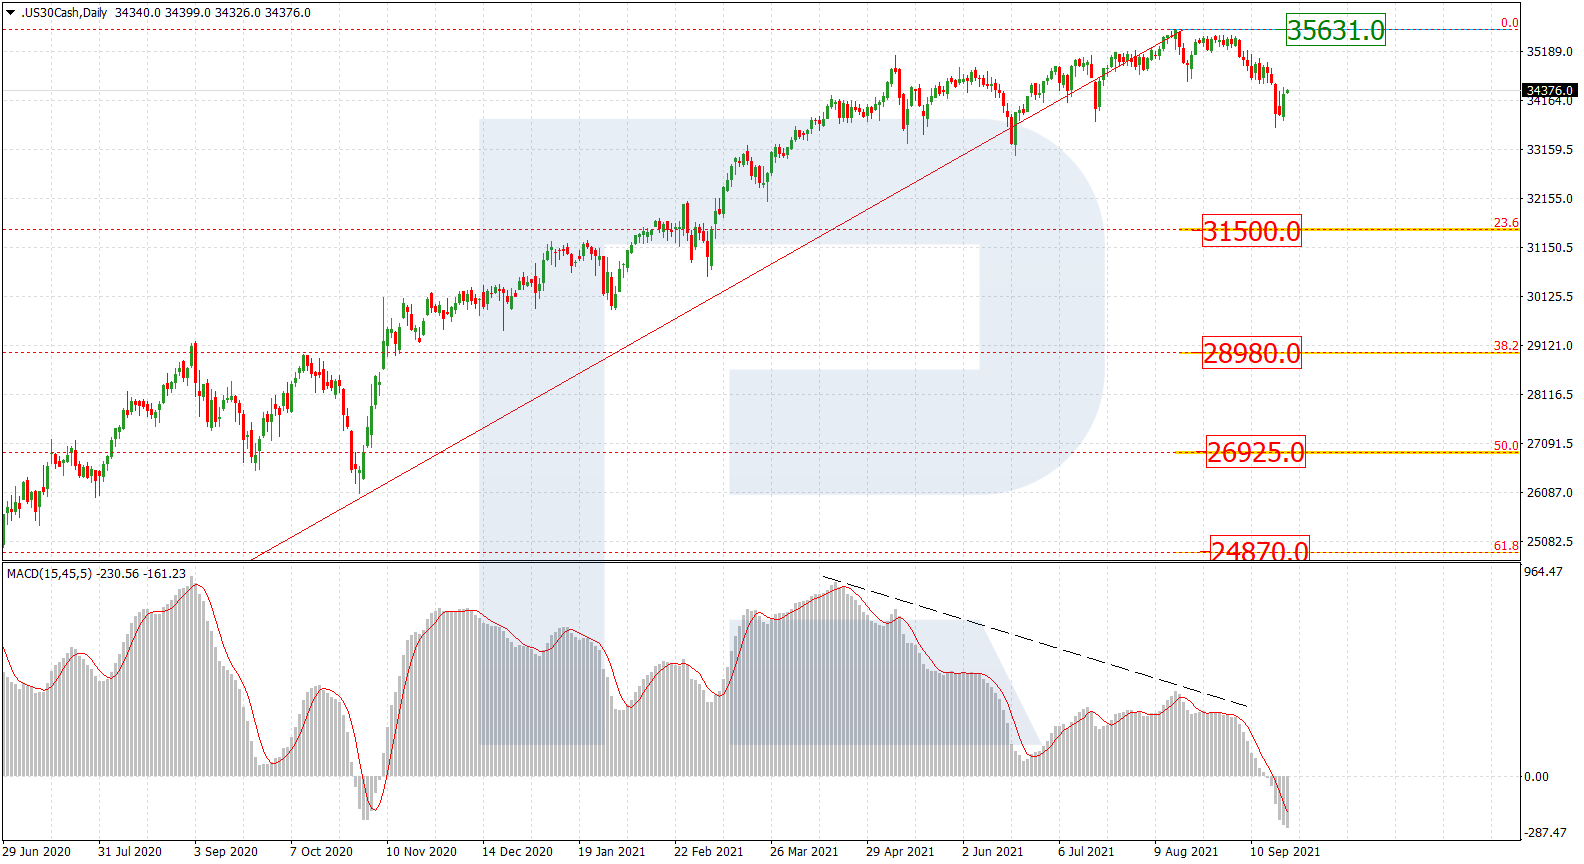
The daily chart shows that the long-term tendency is about to change. The key long-term downside targets are divergence on MACD may be 23.6%, 38.2%, 50.0%, and 61.8% fibo at 31500.0, 28980.0, 269325.0, and 24870.0 respectively. The resistance is the high at 35631.0.
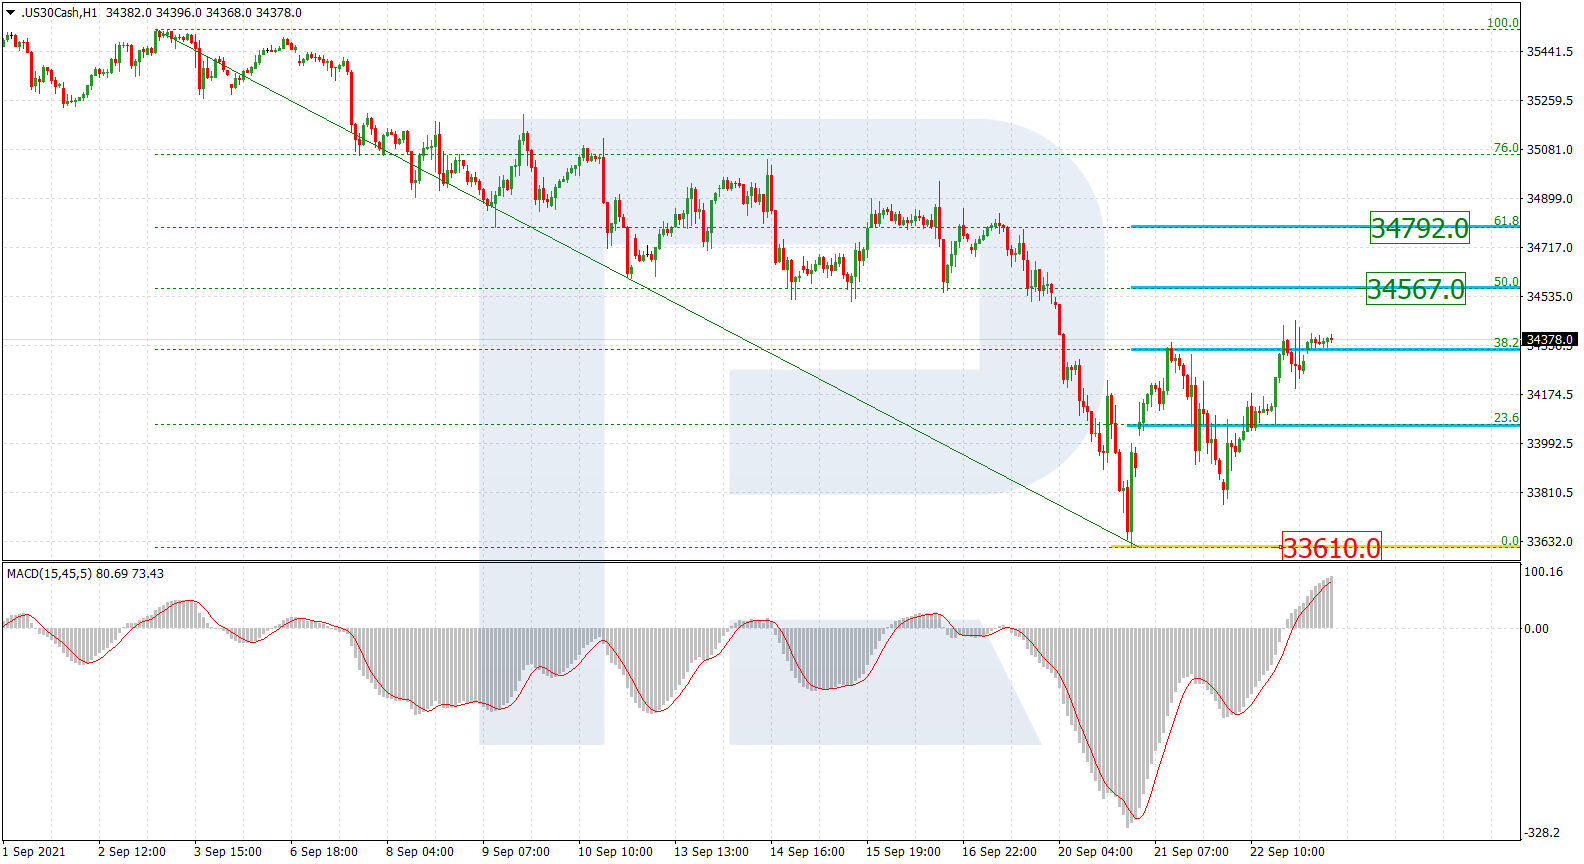
As we can see in the H1 chart, the asset is correcting upwards after completing the previous descending wave; it has already reached 38.2% fibo and may later continue towards 50.0% and 61.8% fibo at 34567.0 and 34792.0 respectively. A breakout of the low at 33610.0 will lead to a further downtrend.
Forecasts presented in this section only reflect the author’s private opinion and should not be considered as guidance for trading. RoboForex bears no responsibility for trading results based on trading recommendations described in these analytical reviews.