Fibonacci Retracements Analysis 12.04.2021 (GOLD, USDCHF)
XAUUSD, “Gold vs US Dollar”
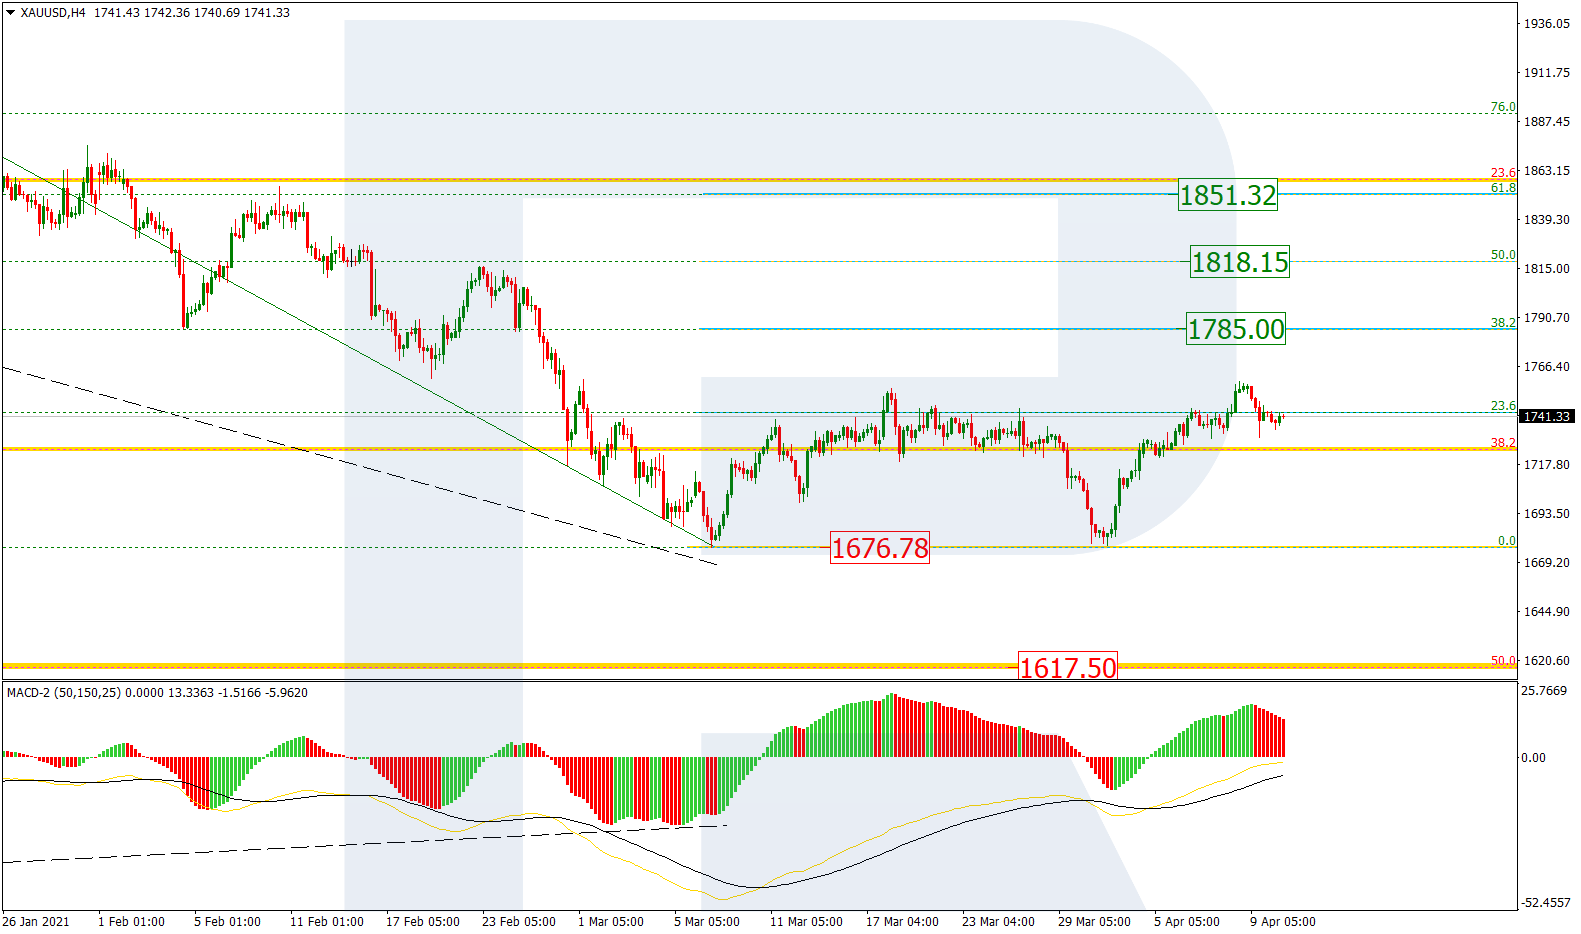
As we can see in the H4 chart, after rebounding from the support area, XAUUSD has re-tested 23.6% fibo. A rebound from the support area may be a signal in favor of a further correction. In this case, the correctional targets may be 38.2%, 50.0%, and 61.8% fibo at 1785.00, 1818.15, and 1851.32 respectively. After completing the correction and breaking the low, the market may continue falling to reach its mid-term target, which is 50.0% fibo at 1617.50.

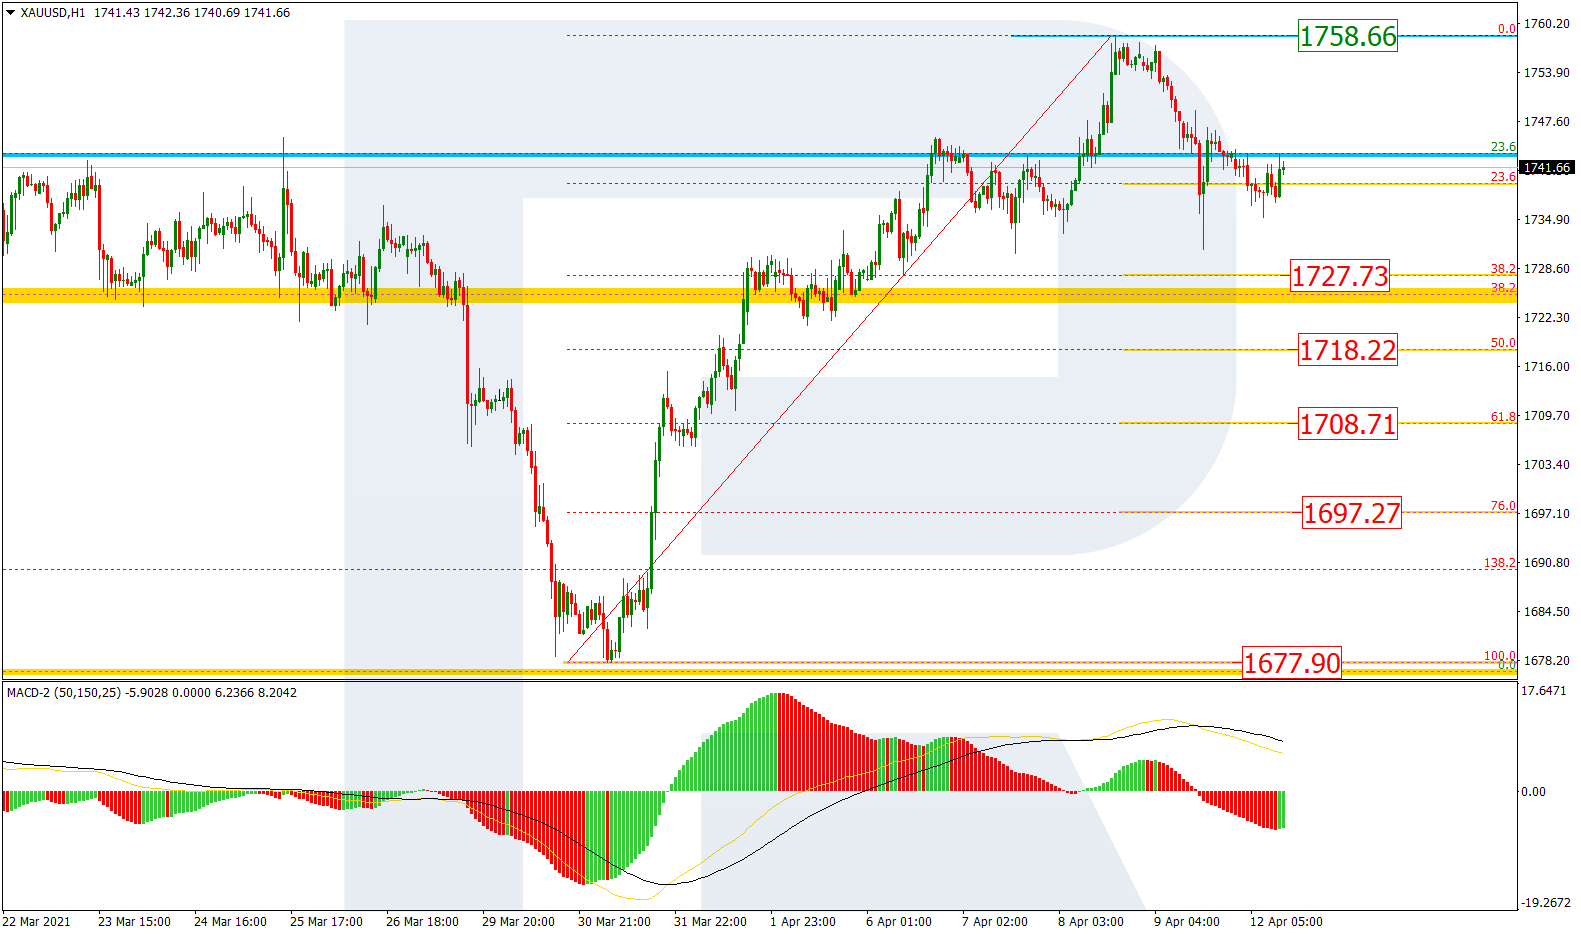
The H1 chart shows a more detailed structure of the current descending correction. After reaching 23.6% fibo, the asset is testing this level and trying to break it. The next downside targets may be 38.2%, 50.0%, 61.8%, and 76.0% fibo at 1727.73, 1718.22, 1708.71, and 1697.27 respectively. A breakout of the local high at 1758.66 will lead to further mid-term growth.
USDCHF, “US Dollar vs Swiss Franc”
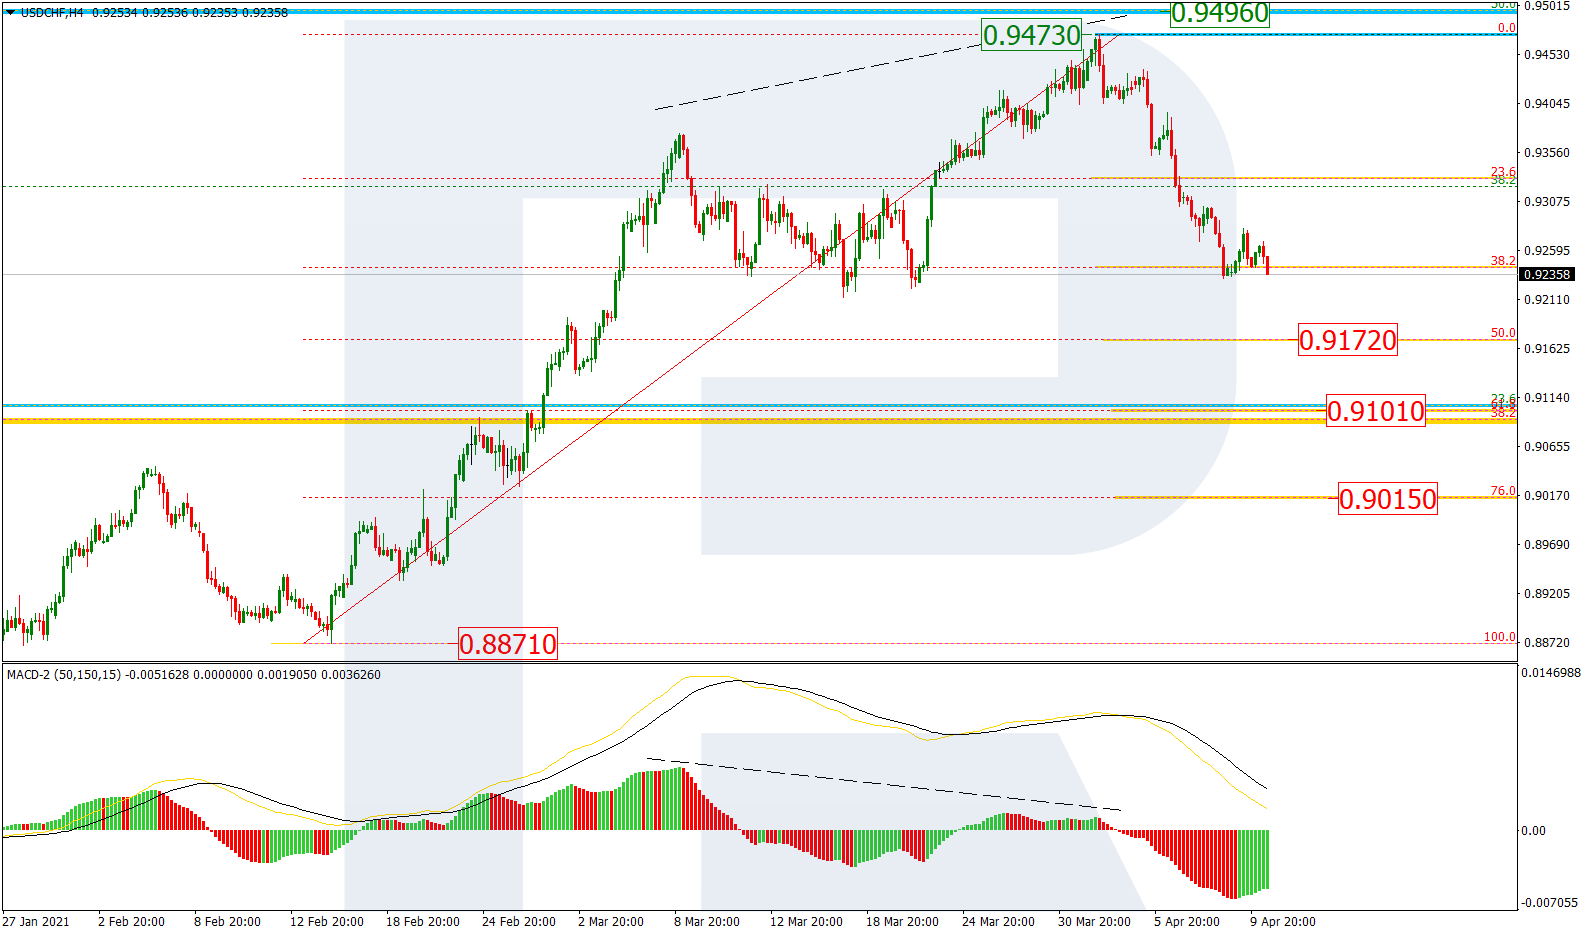
In the H4 chart, a divergence on MACD made USDCHF reverse after reaching 50.0% fibo at 0.9594 and start a new decline, which has already reached 38.2% fibo and may later continue falling towards 50.0%, 61.8%, and 76.0% fibo at 0.9172, 0.9101, and 0.9015 respectively. The key resistance is the high at 0,9473.
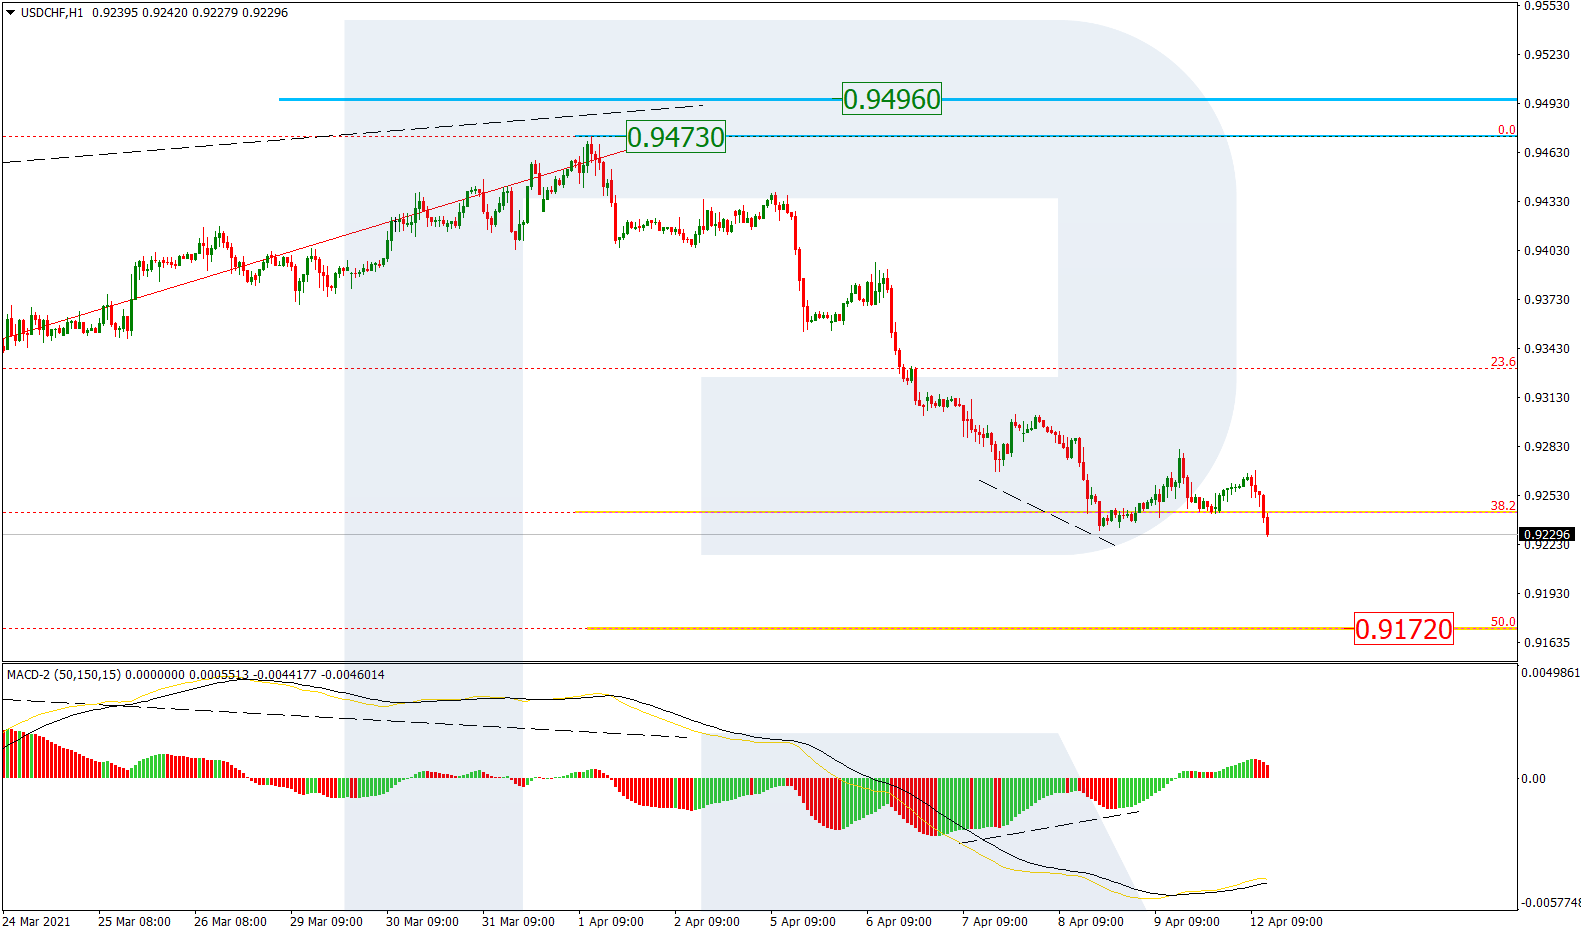
The H1 chart shows a stable downtrend. There was a slight pullback after a local convergence on MACD but right now, the price is falling again to reach 50.0% fibo at 0.9172.
Forecasts presented in this section only reflect the author’s private opinion and should not be considered as guidance for trading. RoboForex bears no responsibility for trading results based on trading recommendations described in these analytical reviews.