Ichimoku Cloud Analysis 10.09.2020 (ETHUSD, NZDUSD, USDJPY)
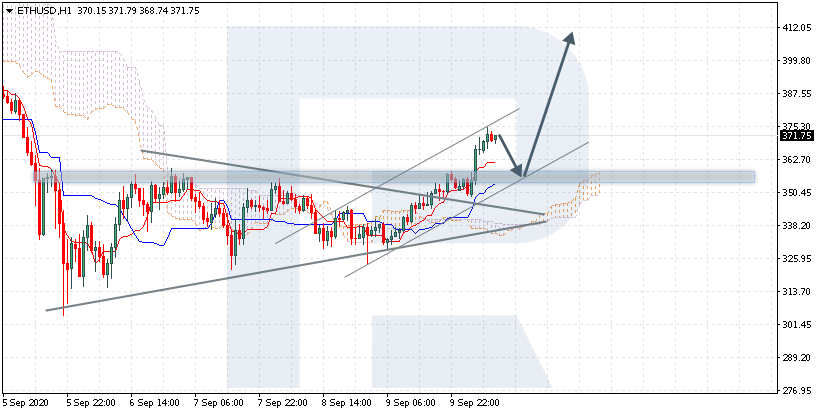
ETHUSD, “Ethereum vs US Dollar”
ETHUSD is trading at 371.15 above the Ichimoku Cloud, suggesting an uptrend. Also, it has broken away the upper border of the Triangle pattern, suggesting the growth of the price for the height of the pattern. A test of the signal lines of the indicator near 355.65 is expected, followed by growth to 410.55. An additional signal confirming the growth will be a bounce off the lower border of the ascending channel. The growth will be canceled in the case of a breakaway of the lower border of the Cloud and securing under 325.05, which will mean further declining to 300.50.

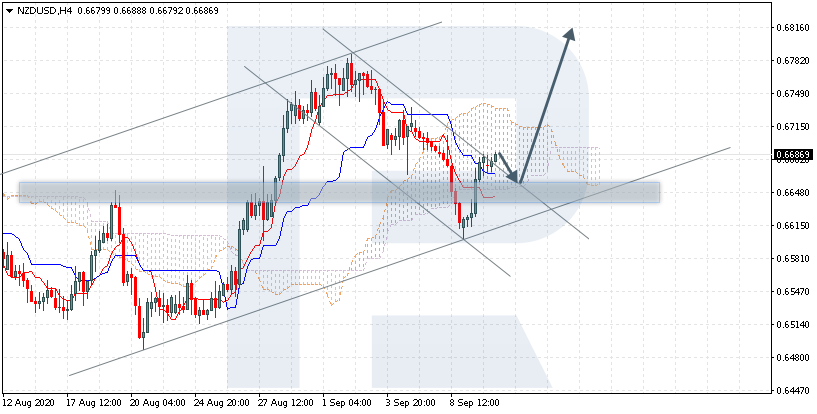
NZDUSD, “New Zealand vs. US Dollar”
NZDUSD is trading at 0.6686 inside the Ichimoku Cloud, suggesting a flat. The quotations returned into the Cloud after they broke through it downwards, which indicates pressure from buyers. A test of the lower border of the Cloud at 0.6650 is expected, followed by growth to 0.6820. An additional signal confirming the growth will be a bounce off the upper border of the descending channel. The growth will be canceled in the case of a breakaway of the lower border of the Cloud and closing under 0.6610, which will mean further falling to 0.6525. Conversely, the growth will be confirmed by a breakaway of the upper border of the Cloud and securing above 0.6750, which will mean the bullish trend resumes.
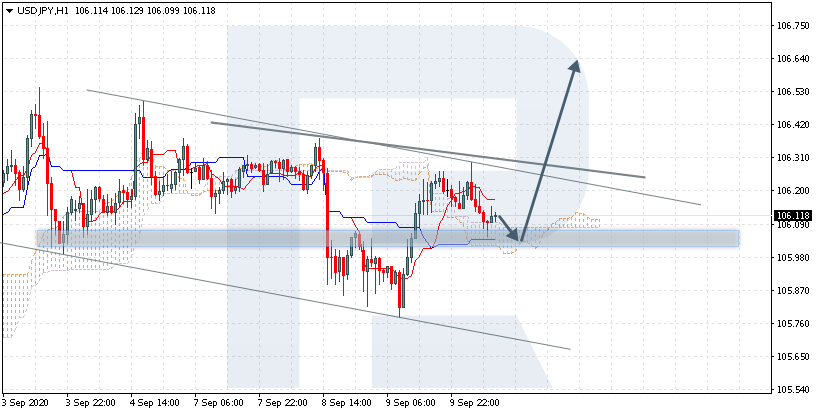
USDJPY, “US Dollar vs Japanese Yen”
USDJPY is trading at 106.11 above the Ichimoku Cloud, suggesting an uptrend. A test of the lower border of the Cloud at 105.85 is expected, followed by growth to 106.65. An additional signal confirming the growth will be a bounce off the support level. The growth will be canceled in the case of a breakaway of the lower border of the Cloud and closing under 105.85, which will mean further declining to 104.95. Conversely, the growth will be confirmed by a breakaway of the upper border of the descending channel and securing above 106.35, which will also mean a reversal Head and Shoulders pattern is forming.
Forecasts presented in this section only reflect the author’s private opinion and should not be considered as guidance for trading. RoboForex bears no responsibility for trading results based on trading recommendations described in these analytical reviews.