Wave Analysis 15.05.2017 (EUR/USD, GBP/USD, USD/JPY, AUD/USD)
EUR/USD
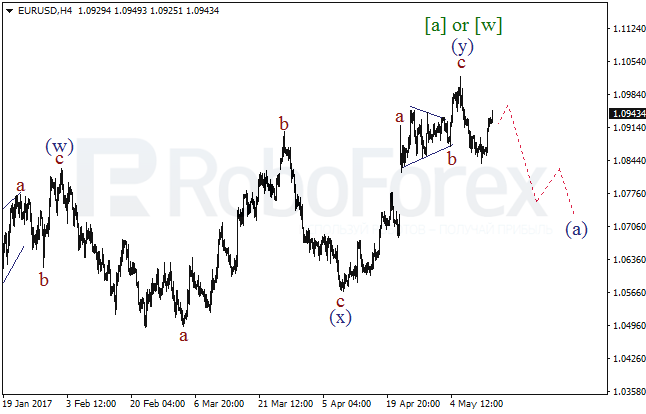
After the double zigzag [a] or [w] was over, a descending impulse in the direction of the wave (а) was formed. As a result, when the local correction is over, we may see how the market resumes its downward movement and breaks below the last low.
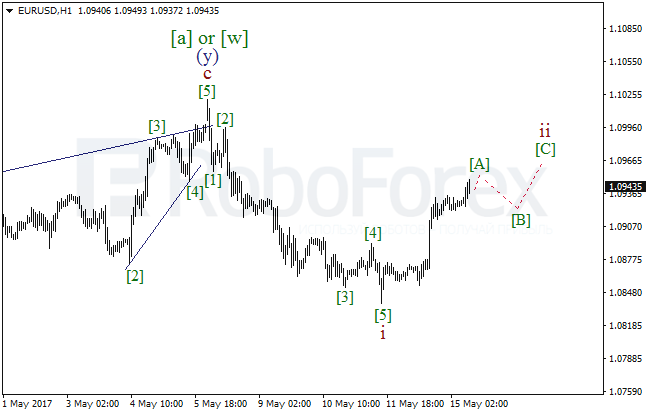
A more detailed explanation is shown on the H1 chart. After the descending impulse within the wave i was over, a correction began. Consequently, later we may see the wave ii moving further, and this will probably become a zigzag.
GBP/USD
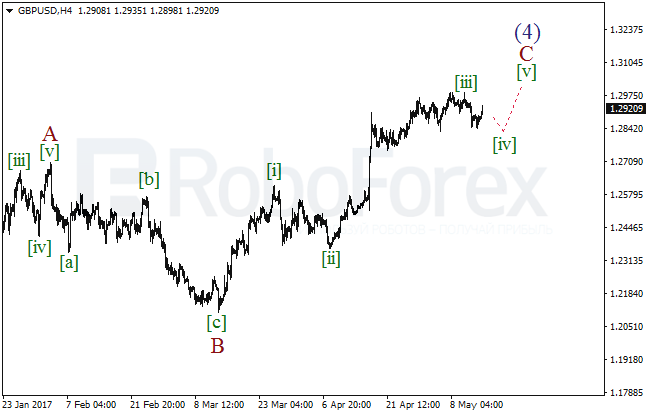
Probably, the extension within the wave [iii] was over, and a new descending correction is in progress now within the wave [iv]. In the coming days we may see how the market continues consolidating. Afterwards we won't exclude the market being rising further within the wave [v] of C.
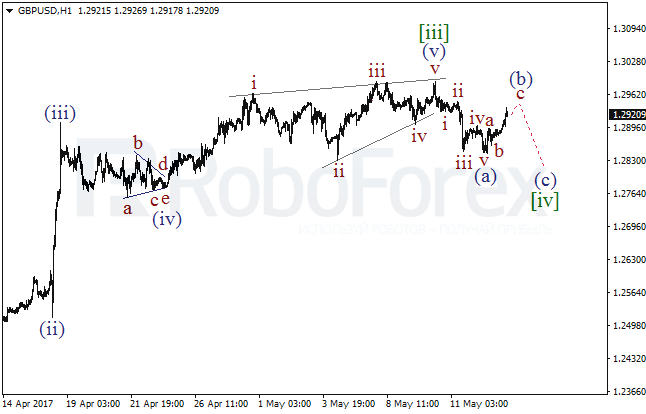
The wave (а) on the H1 chart shows a descending impulse. In the course of Monday, the zigzag within the wave (b) may be over. Correspondingly, the pair may resume moving downwards within the wave (c) of [iv].
USD/JPY
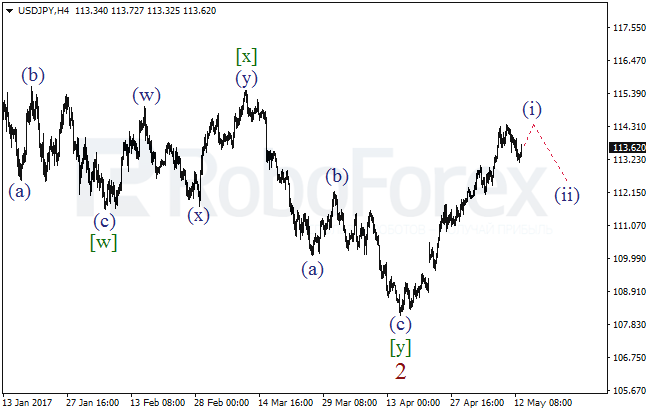
The bullish impulse withing the wave (i) is coming to its end. In the near term, the price can rise and form a new high, but soon after that we may see a start of a descending correction - the wave (ii).
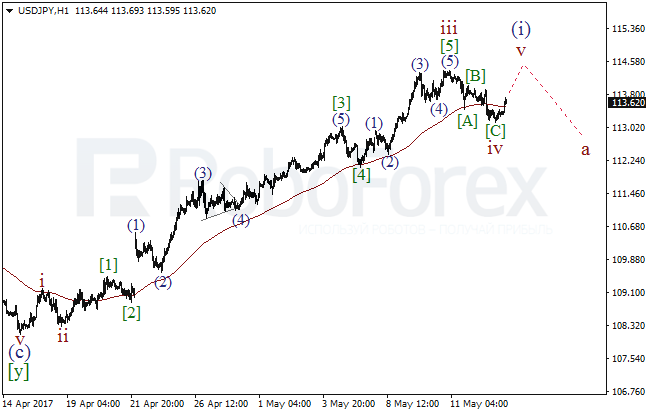
On the H1 chart the market is trying to hold above the Moving Average line suggesting that the wave iv may soon be over. As a result, later we may see a yet another bullish impulse within the wave v of (i).
AUD/USD
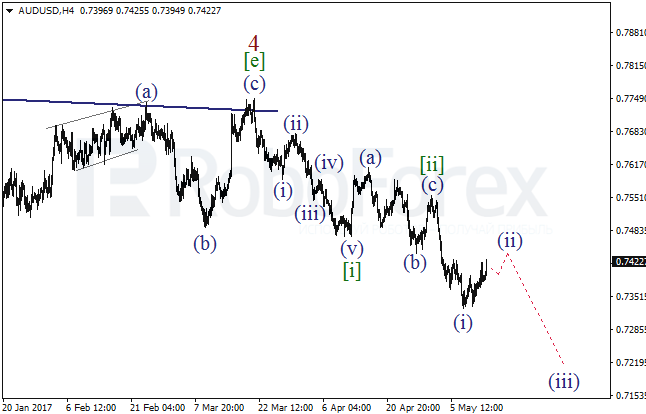
It is not improbable that the descending extension within the wave [iii] with a second wave is being formed. Earlier we saw a flat within the wave [ii]. In the near term, after the correction is over, we may see how the markets continues moving downwards within the wave (iii) of [iii].
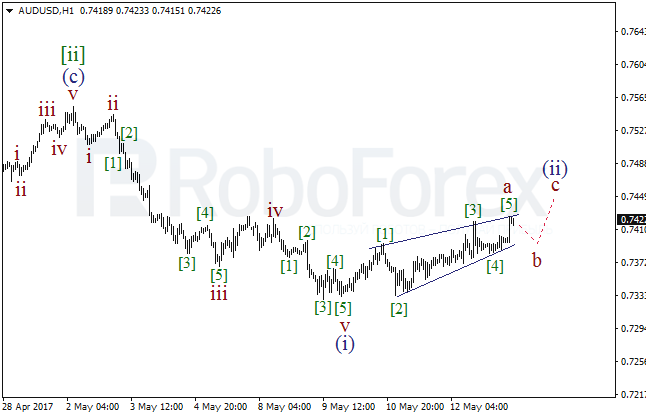
Admittedly, on the H1 chart a wedge is being completed within the wave a of (ii). As such, after a local correction we may see a yet another bullish impulse within the wave c of (ii).
Forecasts presented in this section only reflect the author’s private opinion and should not be considered as guidance for trading. RoboForex bears no responsibility for trading results based on trading recommendations described in these analytical reviews.