Wave Analysis 17.05.2017 (EUR/USD, GBP/USD, USD/JPY, AUD/USD)
EUR USD
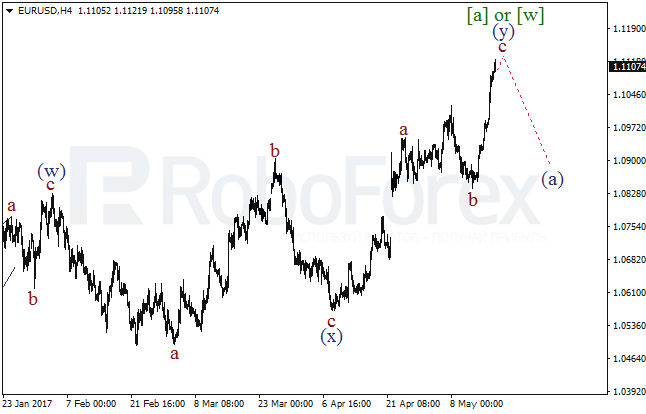
Admittedly, development of a double zigzag in the wave [a] or [w] is coming to an end. In the course of the day the ascending impulse in the wave с of (y) can be completed. If a descending impulse in the direction of the wave (а) is developed, this will be a confirmation of the next round of down movement.
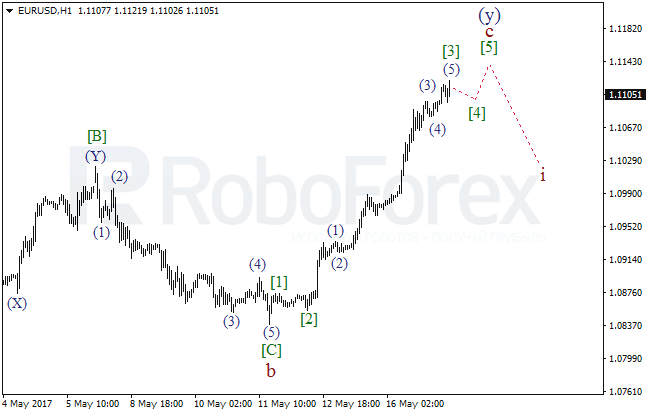
As we can see on the H1 chart, an extension of the 3rd wave within the wave с is being completed now. Consequently, after a local correction is over, a yet another bullish impulse within the wave [5] of c can occur.
GBP USD
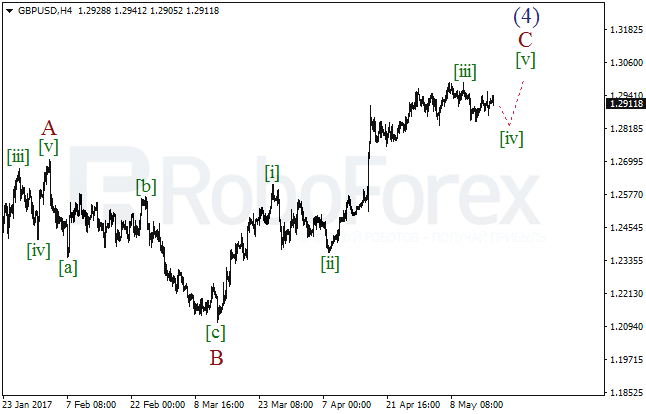
Admittedly, a descending correction within the wave [iv] is being developed. Earlier a long extension within the wave [iii] had been completed. As a result, we can see the consolidation range to be developing further, but after that the price can rise higher within the wave [v] of C.
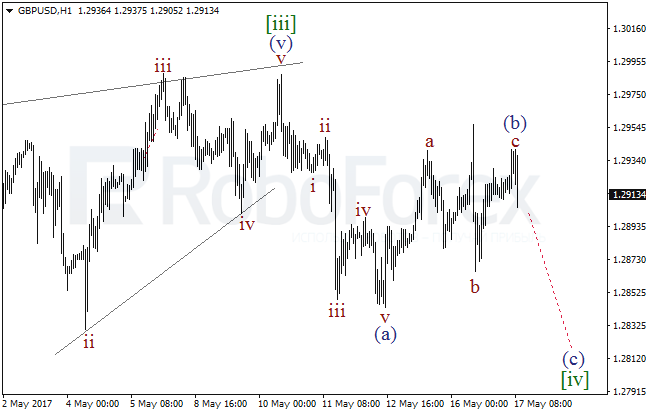
On the H1 chart we see: a descending impulse within the wave (а) and zigzag as a part of the wave (b). Consequently, in the near-term the pair can move even lower within the wave (c) of [iv].
USD JPY
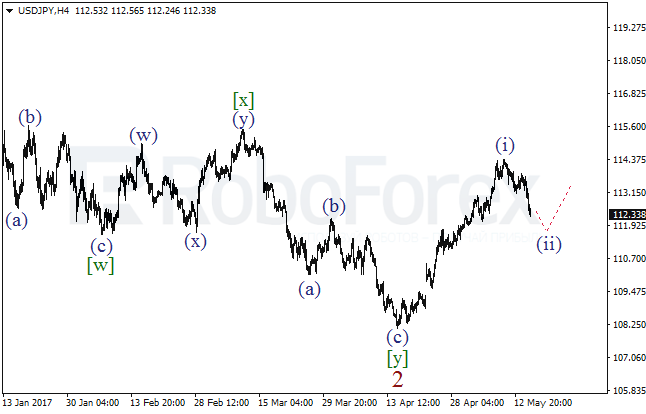
The bullish impulse in the wave (i) has been completed, and this opens the way for a descending correction. In the near-term the pair can lower further within the wave (ii).
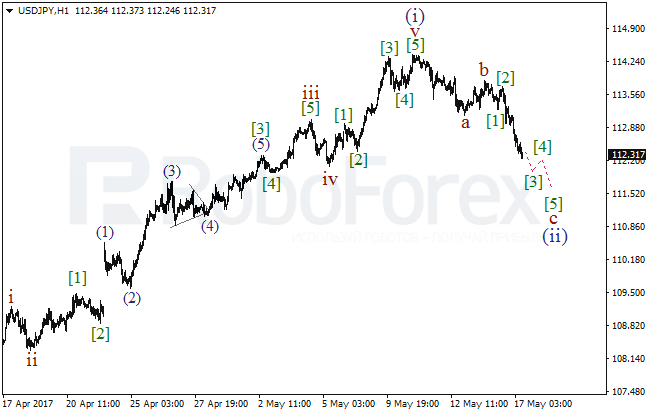
Appearingly, a descending zigzag within the wave (ii) is being formed on H1. On the smaller wave level a bearish impulse within the wave c of (ii) is being developed. In the course of Wednesday the pair can lower further along the current correction move.
AUD USD
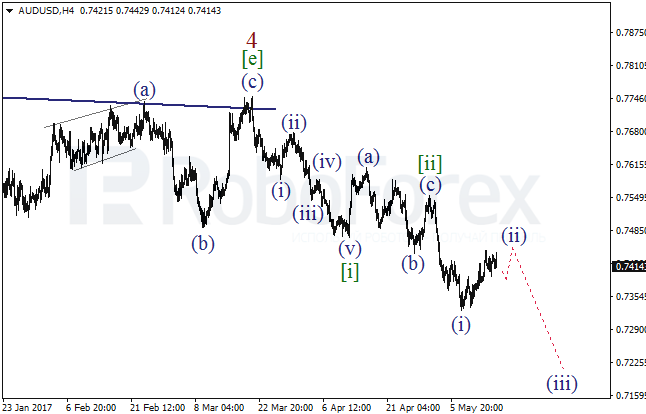
The basic wave scenario tells about development of an extension within the wave [iii] which has the 2nd wave within it being developed. In the near-term the down movement can resume within the wave (iii) of [iii]. Consequently, the low of the wave (i) can be broken shortly.
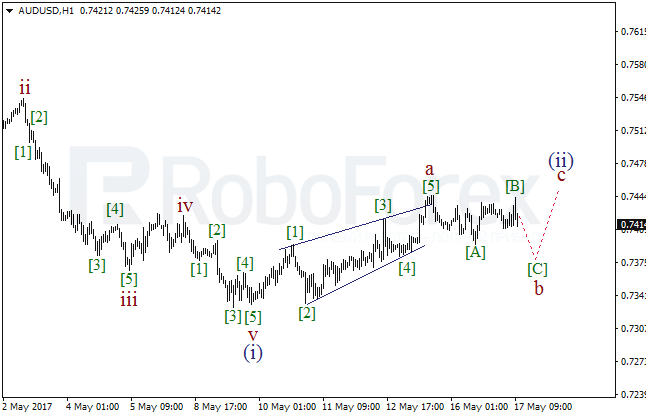
On the H1 chart a wedge within the wave а has been formed. Currently, a zigzag within the wave b is being formed. This wave can clear the way for the pair to move down further within the wave [C] of b. Afterwards a yet another bullish impulse within the wave c of (ii) can be formed.
Forecasts presented in this section only reflect the author’s private opinion and should not be considered as guidance for trading. RoboForex bears no responsibility for trading results based on trading recommendations described in these analytical reviews.