Wave Analysis 18.05.2017 (EUR/USD, GBP/USD, USD/JPY, AUD/USD)
EUR USD
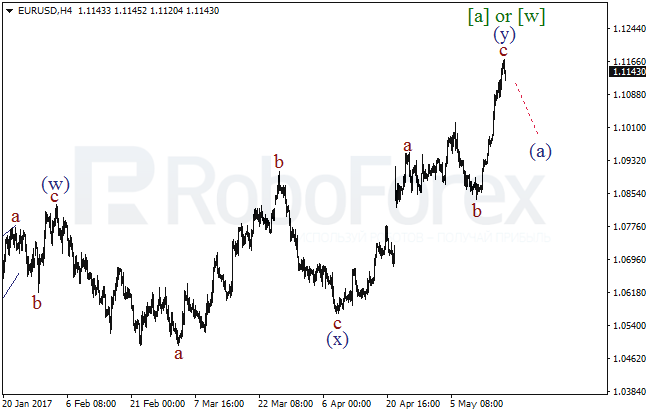
It is not improbable that the double zigzag within the wave [a] or [w] has been completed. Therefore, a descending correction can be started soon. Such a correction is confirmed when a bearish impulse within the wave (а) has been formed.
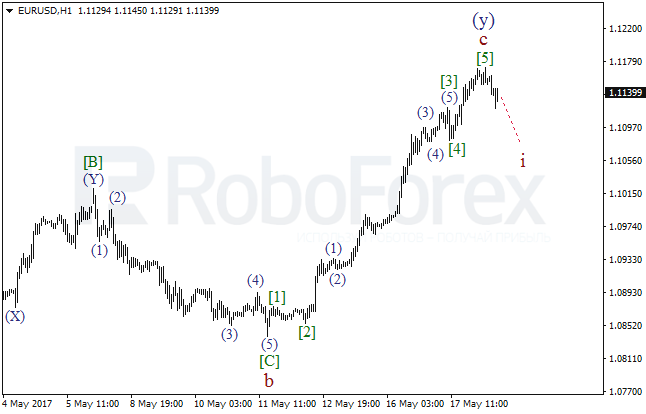
As the analysis on H1 chart shows, the ascending impulse within the wave с of (y) can be deemed completed already. Consequently, in the course of the day we can see a bearish impulse within the wave i of (a).
GBP USD
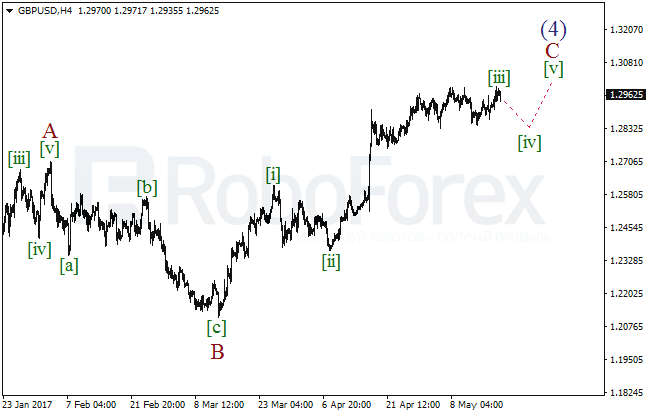
Admittedly, the extension within the wave [iii] has been completed and a new descending correction is gaining momentum within the wave [iv]. In the coming days we can see the consolidation range to continue, bur afterwards a further rise within the wave [v] of C is possible.
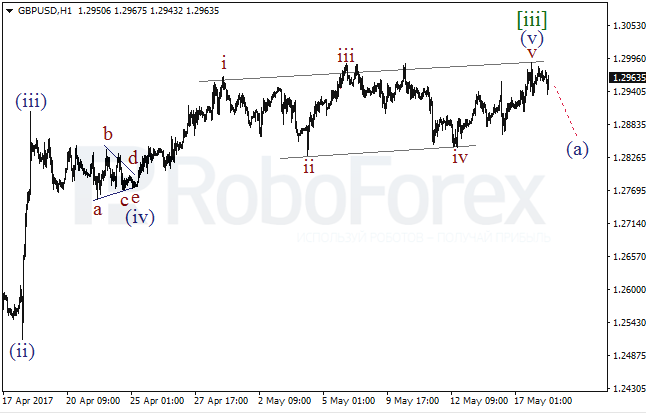
Recently a new local low was formed that lead to redrawing of the wave analysis. There is a strong probability that a diagonal triangle has been formed within the wave (v) of [iii], and this clears the way for the pair to move lower for a short time (а).
USD JPY
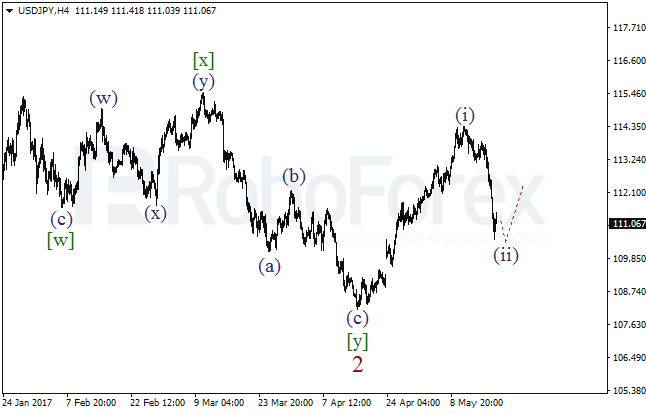
A descending correction within the wave (ii) continues. In the near-term the price can still break the local low, but afterwards the bulls can try to resume lifting the pair higher.
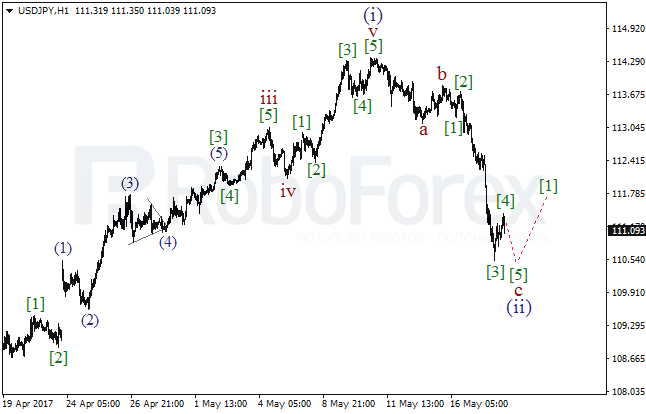
It seems that the descending impulse within the wave c of (ii) is coming to an end. On the minor wave level the pair can still go down within the wave [5] of c. Continuation of the rise is confirmed when a bullish impulse within the wave [1] has been formed.
AUD USD
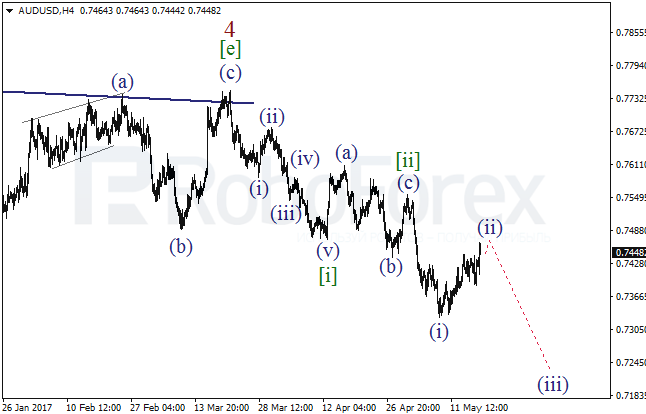
Продолжается формирование нисходящего удлинения в волне [iii], в рамках которой завершается вторая волна. In the near-term, after the correction is over, the pair can resume going down within the wave (iii) of [iii]. Consequently, the price can break through the low of the wave (i) in the short time.
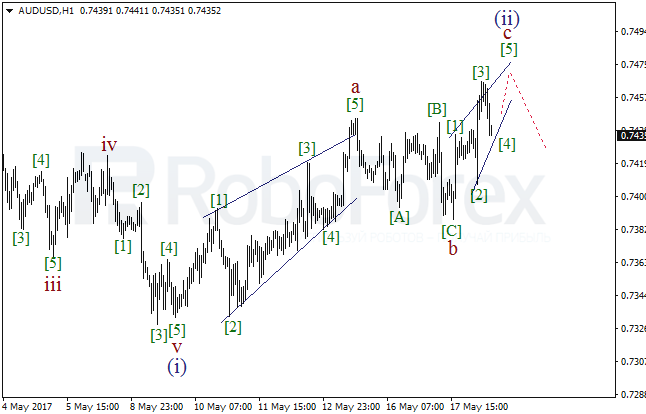
On the H1-chart the zigzag within the wave (ii) is being completed, and a diagonal triangle is being developed as a part of the wave с. Afterwards we can see a new local high while the wave [5] of c is being formed.
Forecasts presented in this section only reflect the author’s private opinion and should not be considered as guidance for trading. RoboForex bears no responsibility for trading results based on trading recommendations described in these analytical reviews.