
To succeed in market trading you should learn to analyze and forecast price movements. The market price is influenced by a whole range of various factors, all of which we literally cannot know. A question emerges: in this case, how does forecasting become possible? This question is answered by one of the basic and most necessary types of market analysis — technical analysis.
All posts
7 min
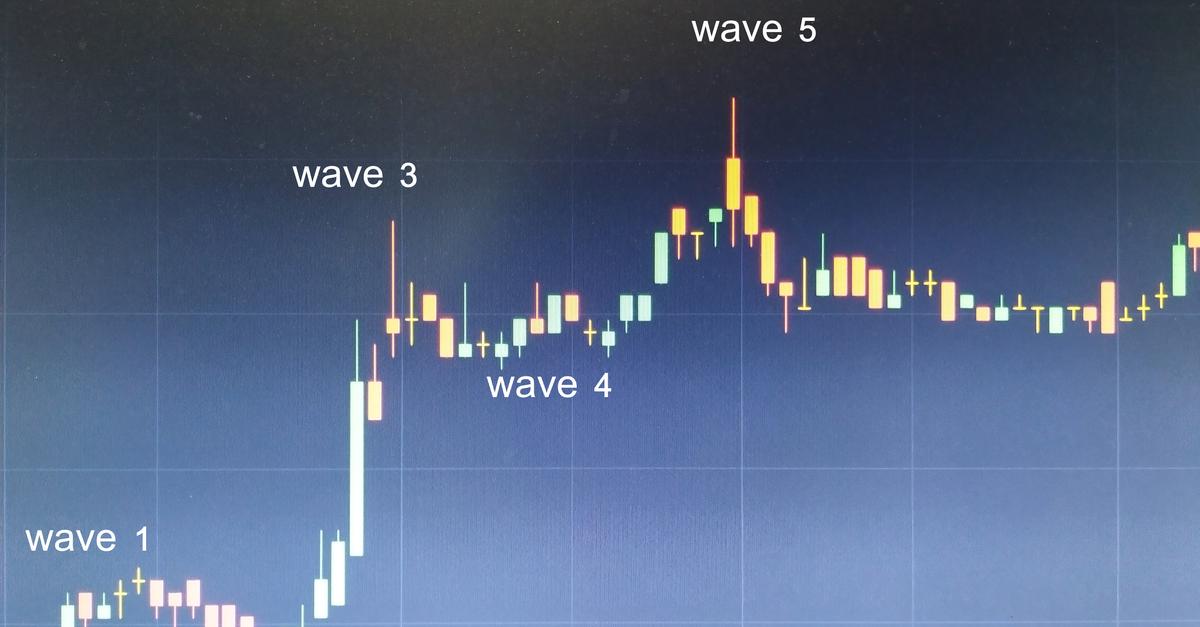
lliott Wave Theory is a unique and independent analytical instrument that, with certain experience, yields impressive results. However, the Theory has not been formalized yet, does not have a shape of a trading system, hence, the result depends on the subjective interpretation of the analyst-trader.

8 min
Trendlines can show where to enter in the direction of the trend and where the current trend might end.

8 min
In the article, we will discuss horizontal support and resistance levels: how to draw them and how to use alongside simple indicators of tech analysis.

5 min
A trend is defined as a sequence of maximums and minimums. If we say that there is a bullish trend on the market, it means that every next maximum is higher than the previous one and every next minimum is also higher than the previous one. In this case only, we may presume that the trend is ascending and try buying.

4 min
Professionals of currency and stock exchange markets have two completely different ways to analyze assets: fundamental and technical.