In this overview, we will discuss trading the Rectangle pattern. This is a universal tech analysis pattern that may be traded both individually and as a part of other patterns.
All posts
6 min
Today, we will discuss popular and rather widespread patterns of graphic analysis Double Top, Triple Top and its opposite – Double Bottom, Triple Bottom.
5 min
Today, we will get acquainted with a tech analysis pattern called Diamond. Compared to other tech analysis patterns, the Diamond pattern appears rather rarely on the chart.

8 min
The Forex Racer strategy is designed exactly for this type of chart, and traders say it gives good opportunities for active trading.
5 min
Today, I will speak about a classical method of detecting a trend reversal. Let us have a look at a group of reversal patterns, which are likely to precede a trend reversal.

5 min
In this review, we will discuss a well-known trading pattern - the Gartley Butterfly. You may learn to find this pattern on the chart by yourself or use the ZUP indicator, specially created for finding and drawing the pattern on the price chart.
6 min
Today, we will discuss yet another trend strategy called Three-Drive or Three Indians. It may have other names but the idea of the strategy and its signals remains the same.

7 min
"3 Candles" is quite a popular Forex strategy that uses no indicators. In this review, we will get acquainted with it and find out how to apply it and to what instruments.

5 min
In this review, we will discuss a well-known trading strategy called the Golden Cross. This simple and efficient strategy uses two Moving Averages with different periods.

7 min
Price Action is focused on the price movement, uses indicators scarcely, features simple and clear rules, it remains an efficient instrument in the hands of an experienced trader.

7 min
The Head and Shoulders pattern is a classical pattern of technical analysis. Let s have a look at its main elements as well as the characteristics of trading with the use of it.

4 min
The Flag and Pennant patterns appear rather frequently on price charts. They are trend continuation patterns, working in the presence of a strong trend, same as trend reversal patterns. When such patterns appear, we may forecast that the trend will continue.

9 min
A Japanese candlestick chart looks like a rectangle with two "tails" on the top and at the bottom. Same as the bars reflects four prices...
8 min
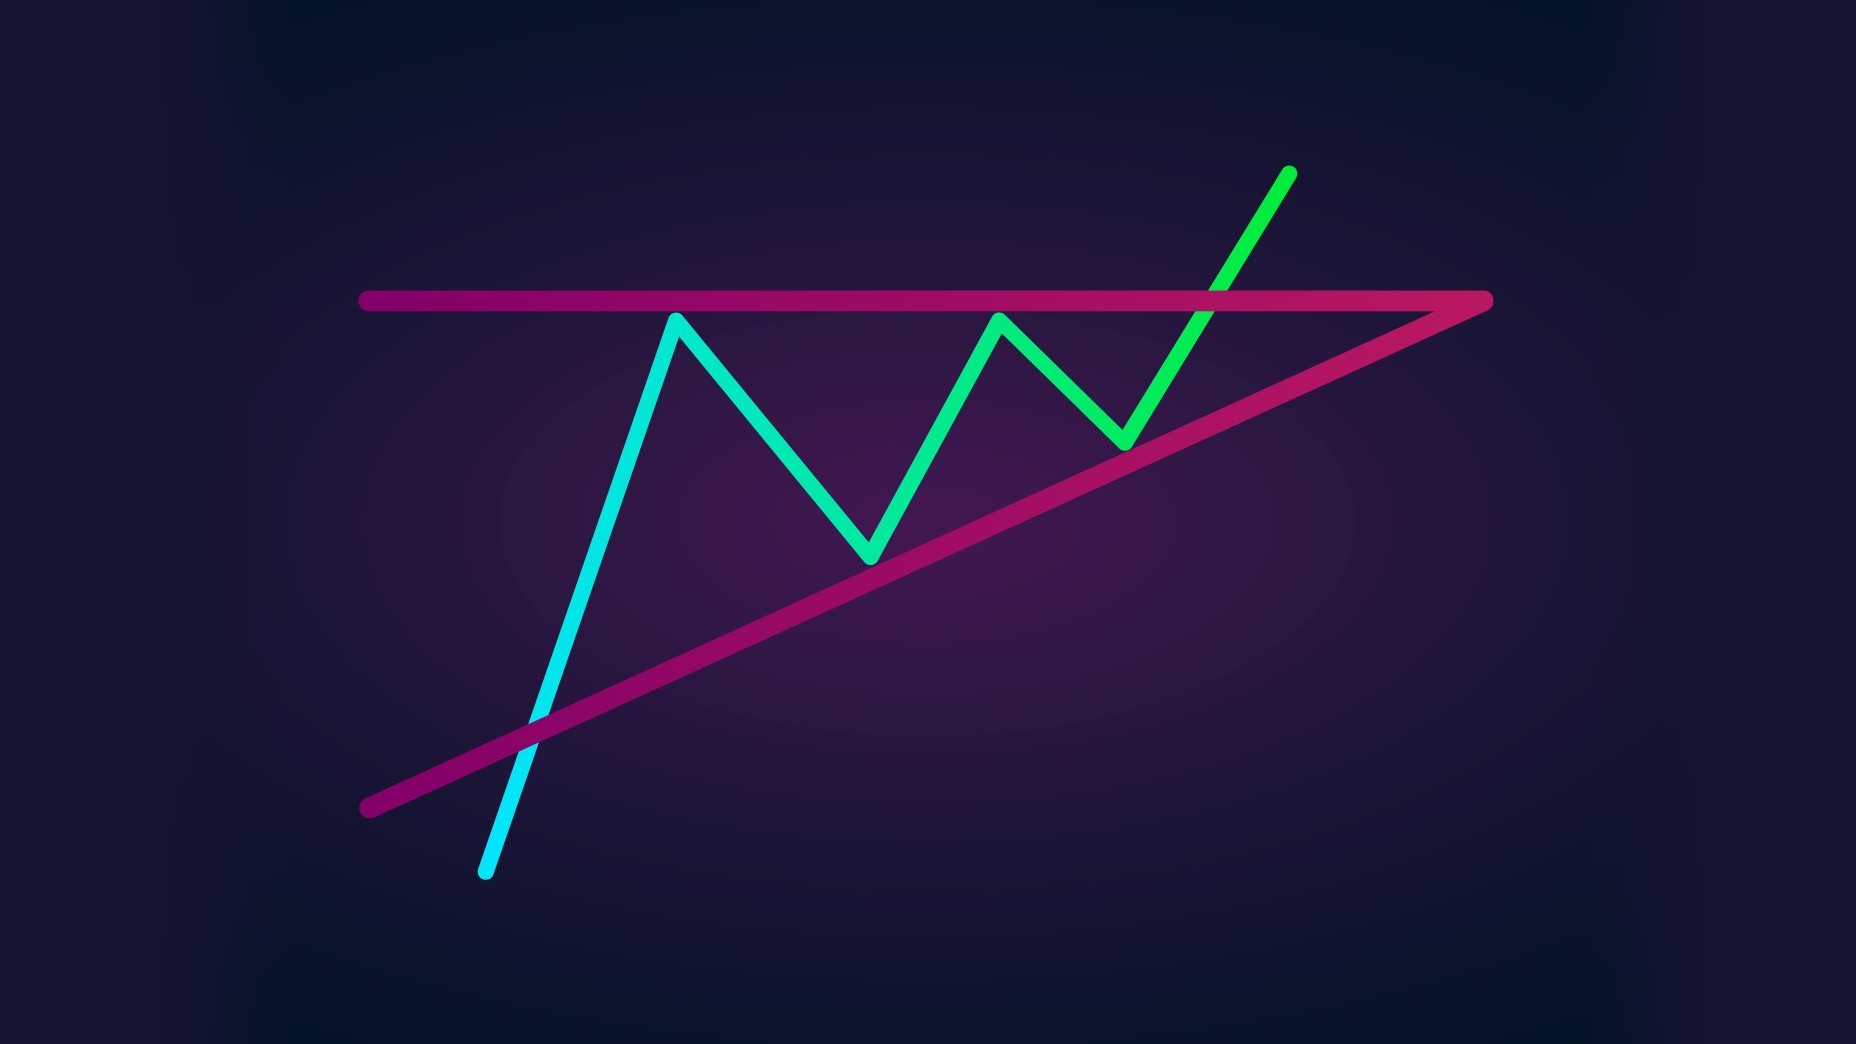
The Triangle pattern appears on different charts rather frequently. Normally, the Wedge is considered a reversal pattern, forming on maximums and minimums of a price chart in an up- or downtrend. A Wedge is quite similar to a Triangle, forming between the two converging support and resistance lines.