Triangle and Wedge Patterns in Technical Analysis

Triangle and wedge patterns form when the price moves between two converging lines, support and resistance, and then breaks out of them. A triangle usually signals that the trend will continue, while a wedge, whose borders slope the same way, usually signals a reversal. Traders enter after the breakout and set the target by the height of the pattern's base.
TL;DR
- Draw the pattern through two highs and two lows and note which way its borders slope.
- Enter after a candle closes outside the border, with the stop loss behind the nearest opposite swing inside the pattern.
- Set the target at the height of the pattern's base, measured from the breakout point.
The Triangle pattern appears on different charts rather frequently. The classic technical analysis considers it a pattern signifying the continuation of the trend; however, in my opinion, this pattern may equally work in line with or against the existing trend.
Description of the Triangle Pattern
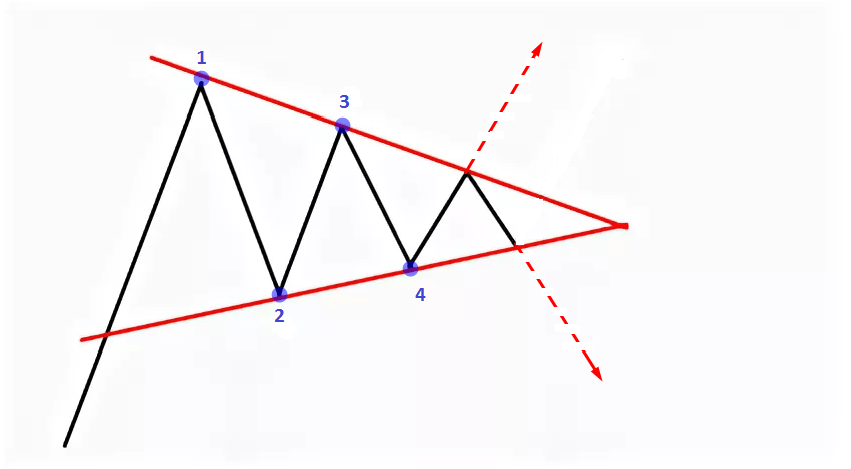
There are several types of the Triangle, each of them having its own specific features. On the chart, a Triangle is composed of the converging (less often diverging) support and resistance lines. To draw a Triangle, four points are to be marked on the chart, which are two subsequent maximums and two subsequent minimums; through these points, the sides of the Triangle (the support and resistance lines) are drawn. As a rule, five waves form inside the Triangle before it is broken through. After the price breaks one of the sides of the Triangle away, there is likely to appear a strong impulse (movement) towards the breakaway. It is similar to a spring that is squeezed inside the Triangle tighter and tighter until it shoots up or down.
Trade on the Go With RoboForex MobileTrader
A portable trading workstation on your phone, on Android and iOS.
Types of the Triangle and Their Execution
There are four types of Triangle in technical analysis.
The four triangles differ in the slope of their borders, and the slope tells you which way the breakout is more likely to go. In a Symmetrical Triangle both borders slope towards each other, so the pattern gives no direction until the price breaks out. In an Ascending Triangle the upper border is flat and the lower one rises: buyers keep pushing, so an upward breakout is more likely. In a Descending Triangle the lower border is flat and the upper one falls, which favours a breakout down. The Diverging Triangle widens instead of narrowing and is traded from its borders, before any breakout. The rules for each triangle pattern follow, and the Wedge, which slopes as a whole, comes after them. For the wider family of reversal and continuation patterns, see the guide to chart patterns.
Equilateral, or Symmetrical Triangle
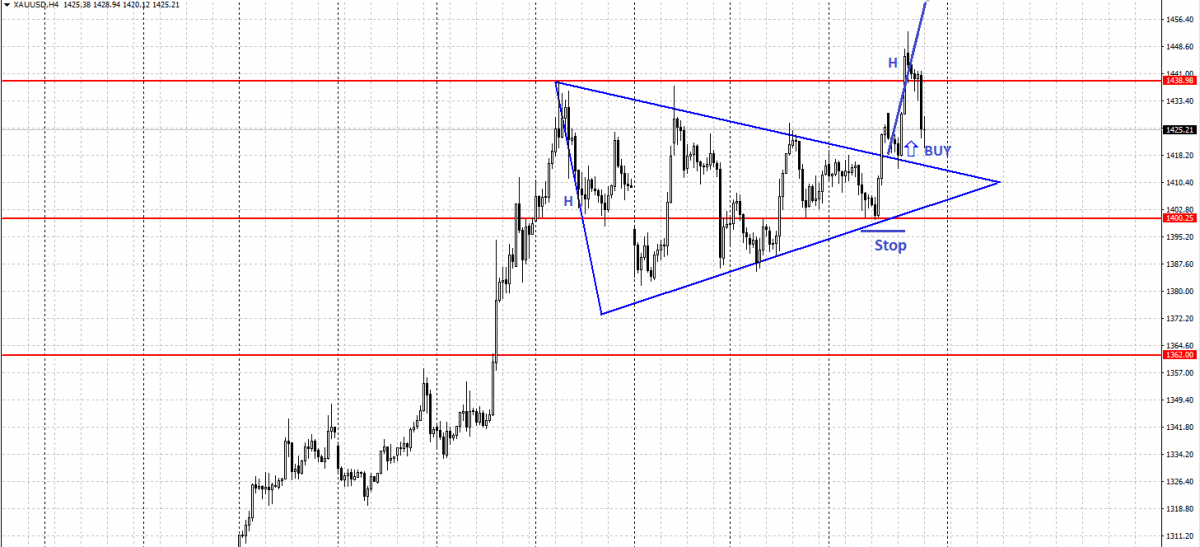
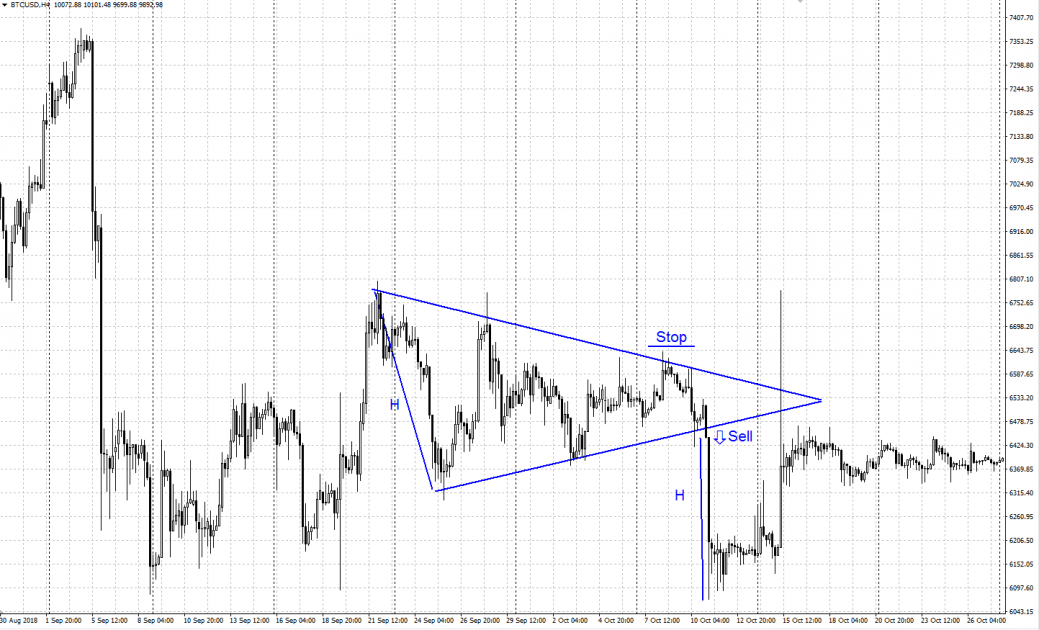
A universal pattern that can either continue the trend or go against it. It is formed by the converging support and resistance lines. The following picture emerges: the bears are gradually pushing the price downwards while the bulls are pushing it upwards from the support line. In the end, some of them turn out stronger, and the price breaks through the border of the Symmetrical Triangle, gathering Stop Losses and pending orders on its way.
A position should be opened in the direction of the breakaway after the price closes outside the borders of the Symmetrical Triangle. If the upper border is broken away, we buy, placing a limiting Stop Loss on the closest minimum of the Triangle; the execution is most likely to be the size of the base of the Triangle (the biggest wave), let us call it H (the value in points). If the lower border of the Triangle is broken away, we sell, placing a Stop Loss on the closest maximum of the Triangle; the size of the execution of the pattern, the H value in points, will be the base of the Triangle (the biggest wave).
Ascending Triangle
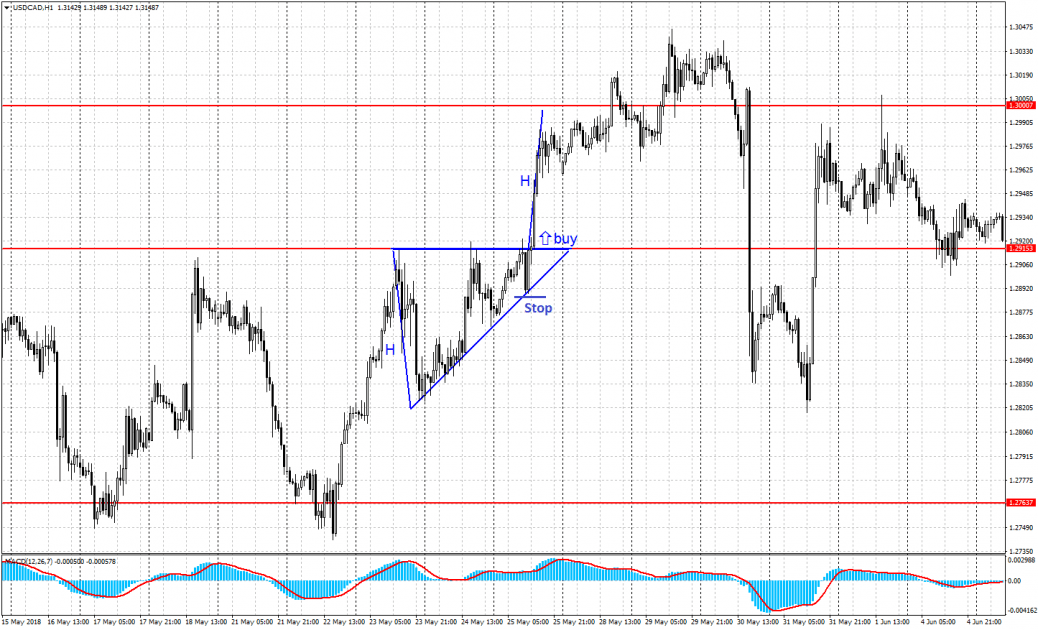
This is the chart pattern of the uptrend continuation, though a reversal execution is sometimes possible. The Ascending Triangle forms between the horizontal resistance level and the ascending support line. In the uptrend, the bulls run into a strong resistance level that they fail to overcome at once. From this level, the price makes pullbacks downwards, which form the waves of the Ascending Triangle. Gradually, they become weaker, and at some moment the bulls, having bought all the bearish Sell orders, break this level away upwards, gathering Stop Losses and pending Buy orders.
Upon a breakaway of the upper border of the Ascending Triangle buying is recommended; the Stop Loss is placed below the closest minimum of the Triangle, the execution is the size of the Triangle base H (in points), which is the biggest wave.
Descending Triangle
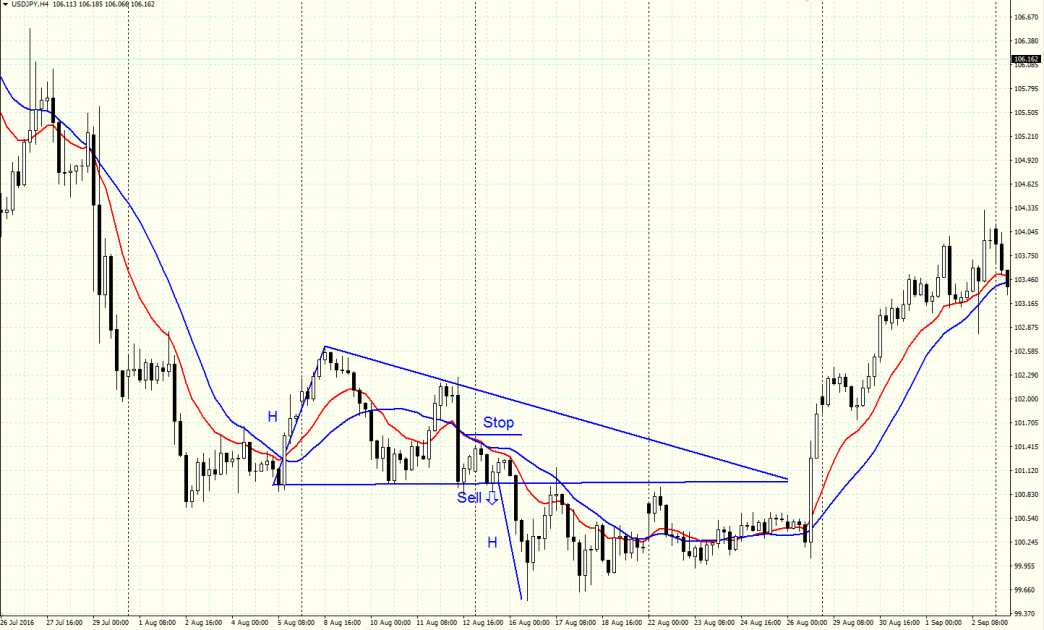
This is the chart pattern continuing a downtrend, though it may sometimes execute against the trend. It is formed by the descending resistance line and the horizontal support level. In a downtrend, the bears bump into a strong support level, which they fail to break through at once. Then several pullbacks from this level upwards follow, forming the Descending Triangle. In the end, the bears sweep all buying orders of the bulls away and break the support level through top-down, gathering Stop Losses and pending Sell orders. After the lower border of the Descending Triangle is broken through it is recommended to sell; Stop Loss is placed above the closest maximum of the Triangle; the size of the execution (H) is the size of the Triangle base, which is its biggest wave.
Diverging Triangle
This chart pattern is opposite to the Symmetrical Triangle; it may signal either the end of the current trend or vice versa, demonstrate a correction, after which the trend will resume. It is formed by the diverging support and resistance lines; the angle is looking to the left. The pattern is traded same as the Converging Triangles: to my mind, it is not really wise to trade it at the border breakaway as the latter happens at the base of the Triangle after the biggest wave, and a technically correct Stop Loss for the closest maximum/minimum will be too large, the stop/profit ratio almost 1 : 1.
So, a position should be entered in advance: if we are expecting growth, we should enter upon the bounce off the support line; if we are waiting for a decline, then, after a bounce off the resistance line. In this case the stop/profit ratio will be comfortable because the Stop Loss at the closest minimum/maximum will be small while the execution (profit), much bigger, at least, spreading to the opposite border of the Diverging Triangle, and if it is broken through, as big as the latest biggest wave of the Triangle (base) as well. For a better understanding of trading in diverging price formations (such as the Diverging Triangle), I can recommend the article: "The Wolfe Waves: Description And Trading Strategy".
Start Trading Now
Forex, stocks, indices and gold on MetaTrader 4 and MetaTrader 5, from a free demo account to a live one.
Description and Execution of the Wedge Pattern
Normally, the Wedge is considered a reversal pattern, forming on maximums and minimums of a price chart in an up- or downtrend. A Wedge is quite similar to a Triangle, forming between the two converging support and resistance lines. The main difference between the two patterns is the inclination of the two lines and the pattern itself: all the lines are inclined either upwards or downwards. In accordance with the inclination of the sides, the Wedge may be of two types: an ascending and descending ones.
Ascending Wedge
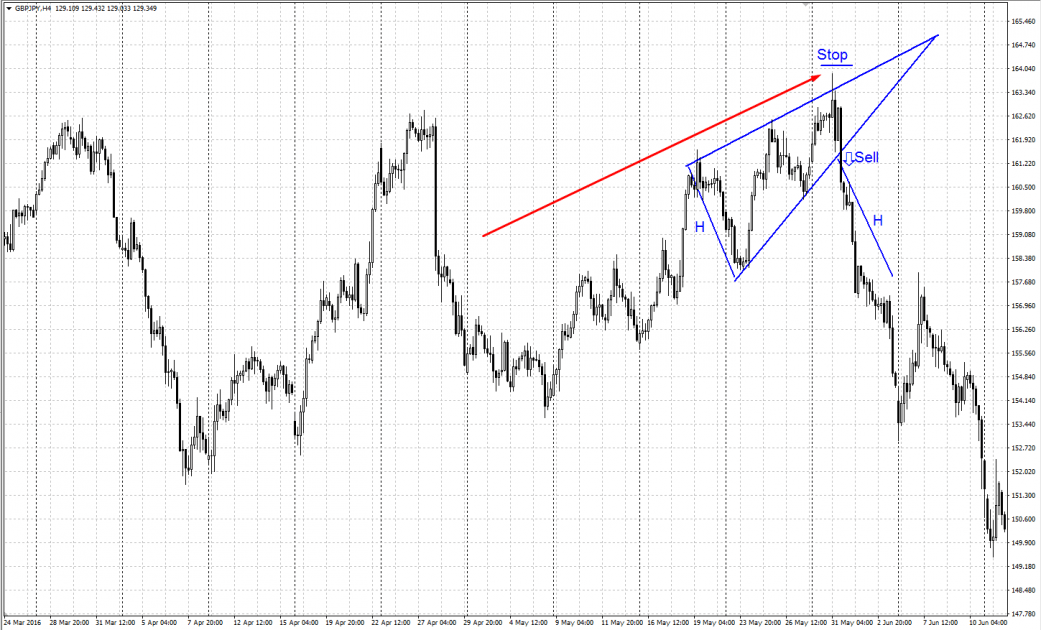
It is formed by the two converging and ascending lines of support and resistance. If the Ascending Wedge forms on the maximums of a price chart in an uptrend, it signals a probable reversal or correction. Upon a breakaway of the lower border of the Wedge, selling is recommended with a Stop Loss above the closest maximum of the Wedge and the execution sized as the H base (the biggest wave at the base of the pattern).
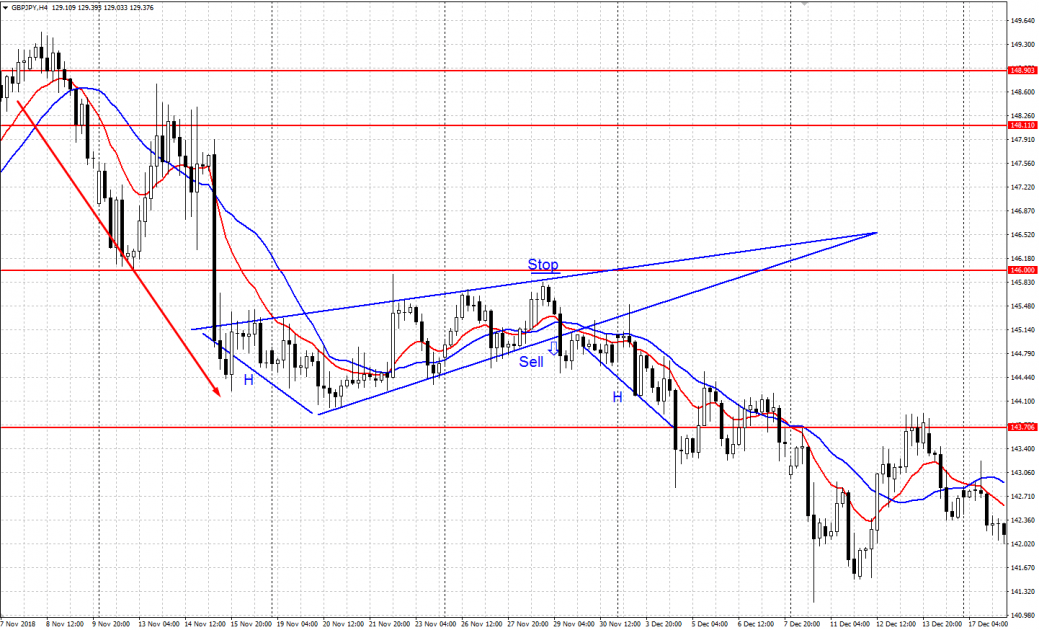
If an Ascending Wedge forms in a downtrend upon the renewal of the minimums, it signifies a correction, and in case the lower border of the pattern is broken through the downtrend is likely to continue. After a breakaway of the lower border of the Wedge selling is recommended, a Stop Loss is placed above the closest maximum, execution is sized as the H base of the Wedge (the biggest wave at the base of the pattern).
Descending Wedge
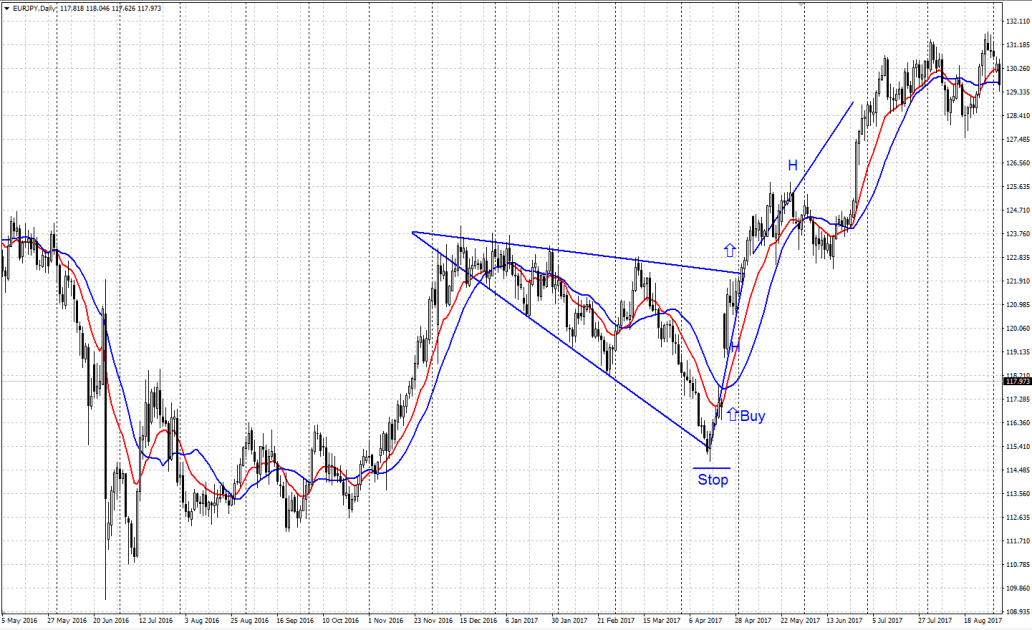
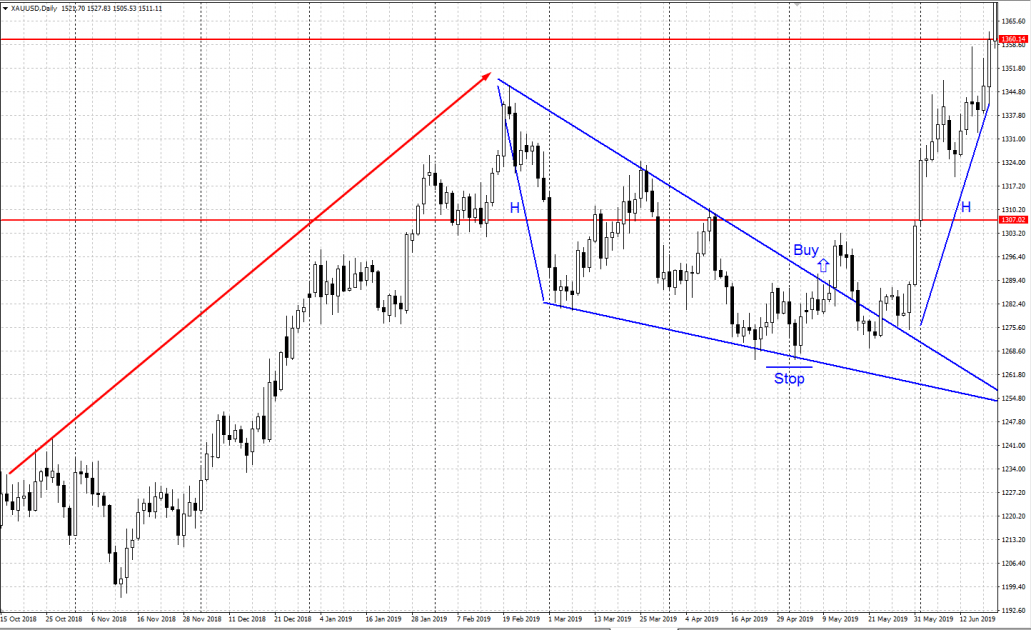
This Wedge pattern is formed by the two converging and descending lines of support and resistance. If a Descending Wedge forms on the minimums of a price chart in a downtrend, it signifies a possible correction or even a reversal. In case the upper border of the pattern (the resistance line) is broken away, buying is recommended, with a Stop Loss below the closest minimum. A profit is locked after growth to the size of the H base (the biggest wave at the base of the pattern).
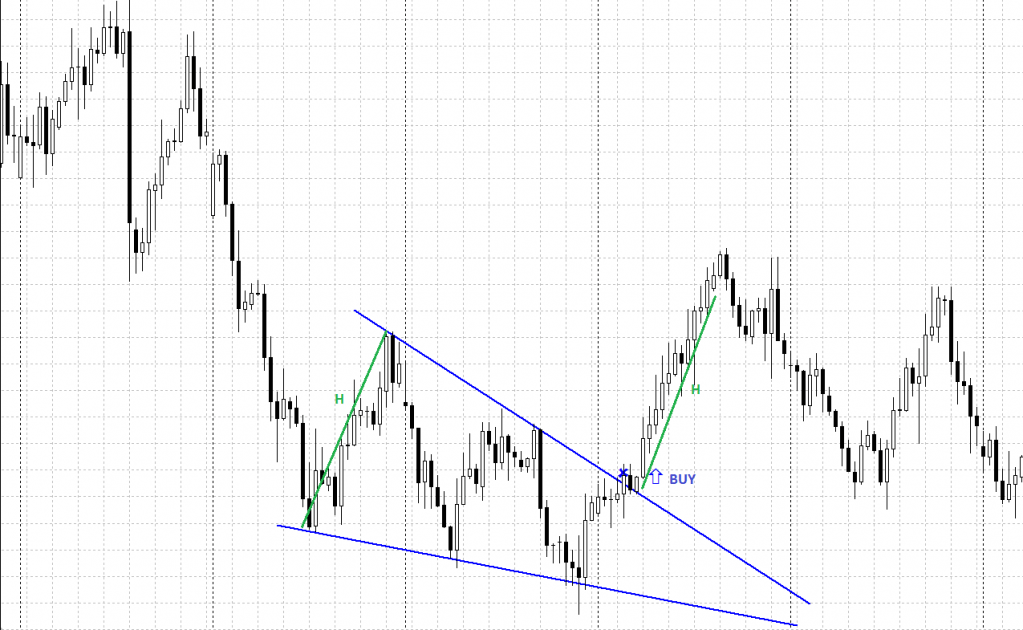
If Descending Wedge forms after renewing the maximums in an uptrend, it may signal the continuation of the trend. In this case a Descending Wedge is a correction after the growth; in case the upper border is broken away, buying is recommended, with a Stop Loss below the closest minimum of the pattern; the execution is expected at least the size of the H base (the biggest wave at the base of the pattern).
The table sums up the entry, stop loss and target rules for every triangle and wedge pattern in this article.
| Pattern | Type | Breakout direction | Entry | Stop loss | Target |
|---|---|---|---|---|---|
| Symmetrical Triangle | Continuation or reversal | Either way | After a close outside the border | Beyond the nearest opposite swing inside the triangle | Height of the triangle base (H) |
| Ascending Triangle | Continuation of an uptrend | Usually up | After a break of the flat upper border | Below the nearest low inside the triangle | Height of the base (H) |
| Descending Triangle | Continuation of a downtrend | Usually down | After a break of the flat lower border | Above the nearest high inside the triangle | Height of the base (H) |
| Diverging Triangle | Reversal or correction | Traded before the breakout | On a bounce off a border | Beyond the nearest low or high | The opposite border, then the base (H) |
| Ascending (rising) Wedge | Usually reversal down | Down | After a break of the lower border | Above the nearest high | Height of the wedge base (H) |
| Descending (falling) Wedge | Usually reversal up | Up | After a break of the upper border | Below the nearest low | Height of the wedge base (H) |
Summary
The Triangle and Wedge chart patterns of technical analysis are rather frequent to appear on charts and may be rather helpful in assessing the perspectives of future price movements. The probability of their execution seems to me rather high, and they are worth including into the portfolio. Only, practice is needed in finding patterns on the price chart and reacting on all other factors, such as the current trend, the stop/profit ratio, and fundamental factors.
FAQ
What is the difference between a triangle and a wedge pattern?
In a triangle the borders slope towards each other from opposite sides, or one of them is flat. In a wedge both borders slope in the same direction, up or down. Triangles usually signal a continuation of the trend, wedges usually a reversal.
Is an ascending triangle bullish?
Usually yes. The flat upper border shows sellers holding one level, while the rising lower border shows buyers paying more on each dip. The pattern normally breaks upward and continues an uptrend, although a downward breakout is possible.
What is a diverging triangle pattern?
A diverging, or expanding, triangle has borders that move apart instead of narrowing, so each swing is bigger than the last. It is traded from its borders: buy on a bounce off support and sell on a bounce off resistance, because waiting for the breakout makes the stop loss too large.
How do you trade a wedge pattern?
Wait for the price to close outside the wedge, against its slope: below a rising wedge or above a falling one. Place the stop loss behind the nearest swing inside the pattern and aim for a move equal to the height of the wedge base.
Which timeframe is best for triangle and wedge patterns?
H1 and above. On higher timeframes the patterns take longer to form, but their breakouts are cleaner and fail less often. On minute charts many small triangles appear and break without follow-through.
Any information provided in articles on this website is based solely on the personal opinions of the authors. These articles should not be construed as trading recommendations or a call to action. The authors and RoboForex accept no responsibility for the results of any trades made on the basis of these recommendations and reviews. Past performance is not indicative of future results. Trading stocks and CFDs involves a high risk of capital loss.