Amazon delivers strong results, confirming business resilience – AMZN shares may reach 350 USD
Amazon reported strong revenue and earnings growth, confirming the resilience of its business amid large-scale investment. The forecast for AMZN shares suggests a test of 250 USD, followed by a move towards 350 USD.
Amazon.com, Inc. (NASDAQ: AMZN) released its Q1 2026 results, which partially eased concerns that had emerged after Q4 2025. In the previous quarter, investors reacted cautiously to the company’s plans to significantly increase investment in AI infrastructure, AWS, proprietary chips, robotics, and satellite internet. In Q1 2026, Amazon demonstrated that these expenditures are not yet hindering business growth: revenue increased by 17% to 181.5 billion USD, operating profit rose by 30% to 23.9 billion USD, and EPS reached 2.78 USD.
The primary growth driver, once again, was AWS: segment revenue grew by 28% to 37.6 billion USD, marking an acceleration compared with the 24% growth recorded in Q4 2025. The retail business also performed better: both the North America and International segments increased operating profit, indicating improved operational efficiency. Net income rose to 30.3 billion USD; however, this figure included a one-off pre-tax gain of 16.8 billion USD related to Amazon’s investment in Anthropic.
Overall, the report appears strong, but part of the profit growth was attributable to a one-off factor rather than Amazon’s core operating performance.
This article reviews Amazon.com, Inc., provides a fundamental analysis of Amazon’s financial results (AMZN), and presents a technical analysis of Amazon shares, forming the basis for the forecast for AMZN shares in 2026. It also outlines the company’s business model, assesses the risks of investing in Amazon.com, and summarises expert forecasts for Amazon shares.
About Amazon.com, Inc.
Amazon.com, Inc. is one of the world’s largest technology companies. It was established by Jeffrey Bezos in 1994 in Seattle, US. Initially, the company specialised in selling books online but has since evolved into a multi-industry platform. Today, Amazon is engaged in e-commerce, provides cloud computing services through Amazon Web Services (AWS), manufactures electronics (such as Kindle and Echo), and develops media services, including streaming and content production.
The company held its IPO on 15 May 1997, listing its shares on the NASDAQ under the ticker AMZN.

Amazon.com, Inc.’s main financial flows
Amazon’s revenue is based on several key segments, reflecting the company’s varied, multisectoral operations:
- Online retail: selling goods directly on behalf of the company, including books, electronics, clothing, household appliances, and more.
- Marketplace: providing the company’s platform to third-party sellers to sell their goods through its website. Amazon generates revenue from sales commissions, paid storage and delivery services and other seller support services.
- Cloud computing (Amazon Web Services): this is the world’s largest cloud service provider. The service includes server rentals, data storage, big data analytics tools, and other cloud solutions. This segment generates Amazon’s highest profits compared to all other business areas.
- Subscriptions (Amazon Prime and other services): providing access to streaming platforms (video and music), cloud storage, and other products. This category also includes revenue from subscriptions to other services, such as Kindle Unlimited and Amazon Music Unlimited.
- Advertising: actively developing its digital advertising business, including income from placing advertisements on the platform, such as in search results. Revenue from these and other advertising services has increased significantly in recent years.
- Offline retail stores: physical sales outlets, including Amazon Go and Amazon Fresh stores, Whole Foods Market supermarkets, and speciality book and electronics stores.
- Electronics and technology sales: producing and selling its own products, including the popular Kindle eBooks, Echo smart speakers with Alexa voice assistant, Fire TV streaming boxes, and other technology products.
- Other areas: less significant revenue streams, such as providing logistics services to third parties, acting as an intermediary in book publishing (Amazon Publishing), developing video games (Amazon Game Studios), generating income from the Twitch streaming platform, and pursuing other innovative projects.
These diversified revenue streams enable Amazon.com, Inc. to remain resilient amid changing market conditions and to expand its influence across multiple sectors.
Amazon.com, Inc. Q3 2024 financial results
Amazon reported it ended Q3 2024 with gains across key financial indicators. Below is the main report data:
- Revenue: 158.9 billion USD (+11%)
- Net income: 15.3 billion USD (+54%)
- Earnings per share: 1.43 USD (+52%)
- Operating profit: 17.5 billion USD (+55%)
Revenue by segment:
- North America: 95.5 billion USD (+8%)
- Operating income (loss): 5.7 billion USD (+30%)
- International: 35.9 billion USD (+11%)
- Operating income (loss): 1.3 billion USD – in Q3 2023, the company posted a loss of 95 million USD
- Amazon Web Services (AWS): 27.4 billion USD (+19%)
- Operating income (loss): 10.4 billion USD (+49%)
All key financial metrics showed growth in Q3 2024. The international segment saw increased sales, but costs also rose concurrently. As a result, it remained the most vulnerable and could be the first to incur losses in the event of even minor economic disruptions.
The North American segment contributed the most to the company’s total revenue but also incurred the highest costs.
AWS remained Amazon’s most promising and profitable division, demonstrating sustained growth and strong profitability.
For Q4 2024, Amazon forecasts revenue between 181.0 and 188.0 billion USD, representing a 7-11% increase compared to the corresponding period in 2023. Operating profit is expected to range between 16.0 and 20.0 billion USD, up from 13.0 billion USD a year earlier.
Amazon.com, Inc. Q4 2024 financial results
Amazon delivered another strong quarter in Q4 2024 with growth across all key financial metrics. The key figures from the report are as follows:
- Revenue: 187.8 billion USD (+10%)
- Net income: 20.0 billion USD (+88%)
- Earnings per share: 1.86 USD (+86%)
- Operating profit: 21.2 billion USD (+60%)
Revenue by segment:
- North America: 115.5 billion USD (+9%)
- Operating income (loss): 9.6 billion USD (+43%)
- International: 43.4 billion USD (+8%)
- Operating income (loss): 1.3 billion USD - In Q4 2023, the company posted a loss of 419 million USD
- Amazon Web Services (AWS): 28.8 billion USD (+19%)
- Operating income (loss): 10.6 billion USD (+48%)
In its commentary on the Q4 2024 report, Amazon’s management provided forecasts for 2025, focusing on revenue, operating profit, and capital expenditures. For Q1 2025, revenue is expected to range between 151.0 and 155.5 billion USD, below the consensus forecast of 158.6 billion USD. Operating profit for this period is projected at 16.0 billion USD, which also falls short of analysts’ expectations.
The company also announced a significant increase in capital expenditures, which could reach 105.0 billion USD in 2025. This marks a notable rise compared to 77.0 billion USD in 2024 and more than double the 48.0 billion USD spent in 2023. These investments will primarily focus on infrastructure, including expanding the AWS cloud business and developing AI solutions.
AWS is anticipated to remain Amazon’s key growth driver in 2025 due to a trend of companies migrating to cloud infrastructure, the end of the cost optimisation phase, and increasing demand for AI solutions. The company has described artificial intelligence as a once-in-a-lifetime opportunity.
The data indicates that Amazon is heavily investing in developing AWS and AI, with substantial investment in infrastructure. However, the weaker-than-expected revenue and operating income forecast for Q1 2025 has disappointed investors, negatively impacting the share price.
Amazon.com, Inc. Q1 2025 financial results
On 1 May, Amazon.com released its Q1 2025 results for the quarter ended 31 March. Below are the key indicators compared to the same period in 2024:
- Revenue: 155.66 billion USD (+9%)
- Net income: 17.12 billion USD (+64%)
- Earnings per share: 1.59 USD (+62%)
- Operating profit: 18.40 billion USD (+22%)
Revenue by segment:
- North America: 92.89 billion USD (+8%)
- Operating income: 5.84 billion USD (+17%)
- International: 33.51 billion USD (+5%)
- Operating income: 1.01 billion USD (+12%)
- Amazon Web Services (AWS): 29.26 billion USD (+17%)
- Operating income: 11.54 billion USD (+22%)
Amazon.com, Inc.’s Q1 2025 earnings report demonstrated solid results, which may attract investors seeking companies with sustainable growth and operational efficiency.
Net sales rose 9% year-on-year despite an adverse currency exchange effect of 1.4 billion USD. This growth was driven by an 8% rise in North American sales and a 5% increase internationally, confirming Amazon’s ability to strengthen its global market position amid economic uncertainty.
A major achievement for the company was the 64% increase in profit and 22% rise in operating profit, reflecting cost optimisation and improved logistics.
Amazon Web Services (AWS), the company’s key profit driver, recorded a 17% increase in sales, reaching an annualised revenue of 117 billion USD. However, it slightly underperformed expectations due to reduced corporate spending amid concerns about tariffs and a potential recession. By comparison, Microsoft Azure, within the Intelligent Cloud segment, grew by 21%, while Google Cloud recorded an even more impressive 28% increase. While AWS maintained its market share leadership (29% in Q1 2025 compared to Microsoft’s 22% and Google’s 10%), it lagged behind its competitors in growth rates, likely due to a higher comparison base and a temporary slowdown in corporate investment in cloud technologies.
Amazon’s online advertising segment grew by 19%, generating 13.92 billion USD, further solidifying its position as the company’s third-largest revenue stream.
However, not everything was positive. The company recorded a 1 billion USD write-down due to product returns and inventory adjustments linked to tariffs. This included 800 million USD in losses from North American retail and 200 million USD in international markets.
AMZN shares fell following the earnings release. The decline was attributed to slower AWS growth and a conservative Q2 2025 forecast, with operating profit expected in the range between 13.0 and 17.5 billion USD, below the consensus estimate of 17.8 billion USD. Management’s caution was linked to tariff policies, particularly the potential 145% duties on Chinese goods, which could affect half of Amazon’s product range. Nevertheless, the forecast appears understated, which could allow the company to exceed expectations if consumer demand remains steady and AWS growth recovers.
While risks remain, including tariff pressures and increased competition in the cloud segment, where Microsoft and Google are accelerating growth. However, Amazon’s competitive advantages in logistics, customer loyalty, and innovation remain significant.
Amazon.com, Inc. Q2 2025 financial results
On 31 July, Amazon.com released its Q2 2025 results for the quarter ended 30 June. Below are the key metrics compared with the same period in 2024:
- Revenue: 167.70 billion USD (+13%)
- Net income: 18.16 billion USD (+34%)
- Earnings per share: 1.68 USD (+33%)
- Operating profit: 19.17 billion USD (+30%)
Revenue by segment:
- North America: 100.07 billion USD (+11%)
- Operating income: 7.51 billion USD (+48%)
- International: 36.76 billion USD (+16%)
- Operating income: 1.49 billion USD (+345%)
- Amazon Web Services (AWS): 30.87 billion USD (+17%)
- Operating income: 10.16 billion USD (+9%)
Amazon exceeded expectations for both revenue and profit in Q2 2025 while maintaining high operational efficiency. Revenue grew by 13% to 167.7 billion USD, operating profit reached 19.2 billion USD, and net income totalled 18.2 billion USD, or 1.68 USD per share. The business segments showed divergent performance: AWS expanded by 17.5%, North America grew by 11%, and the International segment increased by 16%. Advertising was a key growth driver, with revenue rising by 23% to 15.7 billion USD, supporting monetisation across platforms from the marketplace to Prime Video.
In the second half of the year, the company expected Q3 2025 revenue to range between 174 and 179.5 billion USD, with operating income projected at 15.5 to 20.5 billion USD. Investors perceived this as a cautious outlook, given the high expectations for AI and the cloud.
For the second consecutive quarter, Amazon’s AWS growth lagged behind its competitors. In Q2, AWS revenue grew by 17% year-on-year, but this was noticeably slower than Microsoft Azure (+39%) and Google Cloud (+32%). The main reason was the uneven distribution of AI workloads: Azure’s growth is driven by its integration with OpenAI and a wave of AI workloads, while Google Cloud benefits from large deals and the use of AI data.
AWS primarily serves mature corporate clients with traditional cloud services, which means its growth is steady but less impressive than its competitors, who are benefiting from a greater number of new AI use cases. Additionally, Amazon is actively investing in expanding its infrastructure for AI, which increases costs and temporarily reduces margins.
As a result, the slower growth rates do not imply that AWS is losing ground. Amazon is building the necessary infrastructure for AI and gradually scaling up its capabilities.
Amazon.com, Inc. Q3 2025 financial results
Amazon.com reported its Q3 2025 financial results on 30 October, covering the quarter ended 30 September. Below are the key figures compared with the same quarter in 2024:
- Revenue: 180.17 billion USD (+13%)
- Net income: 21.19 billion USD (+38%)
- Earnings per share: 1.95 USD (+37%)
- Operating profit: 17.42 billion USD (0%)
Revenue by segment:
- North America: 106.27 billion USD (+11%)
- Operating income: 4.79 billion USD (–15%)
- International: 40.90 billion USD (+14%)
- Operating income: 1.20 billion USD (–8%)
- Amazon Web Services (AWS): 33.01 billion USD (+20%)
- Operating income: 11.43 billion USD (+9%)
Amazon’s Q3 2025 report came in ahead of analyst expectations. Revenue rose by 13% to 180.2 billion USD, surpassing the market consensus of around 178 billion USD, while earnings per share reached 1.95 USD versus the forecast of roughly 1.56 USD. The company exceeded expectations on both the top and bottom lines. Excluding one-off expenses, the results would have been even stronger. Operating profit totalled 17.4 billion USD; however, this figure included 4.3 billion USD in one-off charges (2.5 billion USD related to FTC litigation and 1.8 billion USD linked to layoffs). Without these items, operating profit would have been approximately 21.7 billion USD, with an operating margin of 12% compared with the reported 9.7%.
Net income increased to 21.2 billion USD (+39% y/y), but a significant portion was attributed to a one-off gain of 9.5 billion USD from the revaluation of Amazon’s stake in Anthropic, unrelated to its core operations.
Performance across segments was also strong: North America revenue grew 11%, international operations expanded 14%, and AWS advanced 20% – its fastest growth rate in the past 11 quarters. AWS maintained a healthy margin of around 35%, while Amazon’s advertising business grew by more than 20%, becoming an increasingly important source of profitability.
Management noted that the company’s key areas – retail, advertising and cloud – continue to see steady demand even amid weak consumer spending. It particularly highlighted the acceleration of AWS growth, driven by demand for AI solutions and continued enterprise cloud migration.
Guidance for Q4 2025 was similarly upbeat: Amazon expected revenue of 206–213 billion USD (+10–13% y/y) and an operating profit of 21–26 billion USD. The company also noted that capital expenditure for 2025 would total around 125 billion USD and is expected to rise further in 2026, primarily due to investments in AWS infrastructure, Trainium and Inferentia AI chips, robotics and logistics. Free cash flow declined to 14.8 billion USD owing to increased investments.
Amazon.com, Inc. Q4 2025 financial results
On 5 February, Amazon.com, Inc. (NASDAQ: AMZN) released its Q4 2025 financial results for the quarter ended 31 December. Below are the key figures compared with the same period in 2024:
- Revenue: 213.38 billion USD (+14%)
- Net income: 21.19 billion USD (+6%)
- Earnings per share: 1.95 USD (+5%)
- Operating profit: 24.98 billion USD (+18%)
Revenue by segment:
- North America: 127.08 billion USD (+10%)
- Operating income: 11.47 billion USD (+24%)
- International: 50.72 billion USD (+17%)
- Operating income: 1.04 billion USD (–21%)
- Amazon Web Services (AWS): 35.58 billion USD (+24%)
- Operating income: 12.47 billion USD (+17%)
Amazon’s Q4 2025 report delivered mixed results relative to market expectations. The company reported revenue of 213.4 billion USD, up 14% compared with the same quarter last year and above analysts’ forecasts. Revenue increased across all key segments: retail sales rose, the international business delivered double-digit growth, and Amazon Web Services expanded revenue by 24%, marking its fastest growth in several quarters.
Earnings per share came in at 1.95 USD, slightly below consensus expectations (around 1.97 USD), even though net income in absolute terms increased year-on-year (from 20.00 to 21.19 billion USD).
In its commentary, management emphasised a significant expansion of infrastructure investment, including plans to spend around 200 billion USD in 2026 to support AWS, AI infrastructure, the development of proprietary chips, robotics, and low Earth orbit satellite networks.
Amazon also provided guidance for Q1 2026, forecasting revenue of 173.5–178.5 billion USD and operating income of 16.5–21.5 billion USD, reflecting expectations of continued growth but with a cautious tone, given the seasonal nature of the business and the scale of planned investments.
Amazon.com, Inc. Q1 2026 financial results
On 29 April, Amazon.com released its Q1 2026 results for the quarter ended 31 March. Below are the key figures compared with the same period in 2025:
- Revenue: 182.52 billion USD (+17%)
- Net income: 30.26 billion USD (+77%)
- Earnings per share: 2.78 USD (+75%)
- Operating profit: 23.85 billion USD (+30%)
Revenue by segment:
- North America: 104.14 billion USD (+12%)
- Operating income: 8.27 billion USD (+43%)
- International: 39.79 billion USD (+19%)
- Operating income: 1.42 billion USD (+40%)
- Amazon Web Services (AWS): 37.59 billion USD (+28%)
- Operating income: 14.16 billion USD (+23%)
Amazon’s Q1 2026 results continued the trajectory established in Q4 2025. At that time, the company reported revenue growth of 14%; in the latest quarter, growth accelerated to 17%, with revenue reaching 181.5 billion USD, exceeding analyst expectations. Earnings per share reached 2.78 USD, compared with a forecast of approximately 1.65 USD. Following the cautious guidance issued after Q4 2025, the actual outcome appeared noticeably stronger.
AWS once again became the primary driver of growth. In Q4 2025, cloud revenue increased by 24%, while in Q1 2026, growth accelerated to 28%. The retail business also improved. In North America, revenue rose by 12% year-on-year (compared with 10% in the previous quarter), while operating income increased to 8.3 billion USD. The International segment performed even more strongly: after a Q4 2025 decline in operating income, it generated 1.4 billion USD in operating income in Q1 2026. This indicates a recovery in operational efficiency outside the US.
Net income rose to 30.3 billion USD; however, this figure included a one-off pre-tax gain of 16.8 billion USD related to Amazon’s investment in Anthropic. As a result, the company’s operating performance appears genuinely strong, but reported net income was further boosted by an investment revaluation effect.
In management commentary, particular emphasis was placed on AWS, AI initiatives, the advertising business, and proprietary chips. AWS recorded its fastest growth in 15 quarters. The advertising business exceeded 70 billion USD in revenue over the past 12 months, while proprietary chips reached an annualised revenue run rate of more than 20 billion USD.
For Q2 2026, Amazon forecasts revenue in the range of 194–199 billion USD and operating income of 20–24 billion USD. The guidance points to continued growth; however, for investors, the primary concern remains capital expenditure. Free cash flow over the past 12 months declined to 1.2 billion USD due to substantial investment in AI infrastructure.
Analysis of key valuation multiples for Amazon.com, Inc.
Below are the key valuation multiples for Amazon.com, Inc. based on the Q1 2026 results, calculated at a share price of 266 USD.
| Multiple | What it indicates | Value | Commentary |
|---|---|---|---|
| P/E (TTM) | Price paid for 1 USD of earnings over the past 12 months | 31.54 | ⬤ On a net income basis, the valuation appears moderate for a company of this quality and growth profile. |
| P/S (TTM) | Price paid for 1 USD of annual revenue | 3.86 | ⬤ On a revenue basis, the valuation appears elevated, but it remains acceptable for a business of this scale. |
| EV/Sales (TTM) | Enterprise value to sales, accounting for debt | 3.82 | ⬤ Considering the company’s strong balance sheet, the valuation appears moderately high. |
| P/FCF (TTM) | Price paid for 1 USD of free cash flow | 2324.68 | ⬤ Very expensive due to sharply lower free cash flow amid substantial investment. |
| FCF Yield (TTM) | Free cash flow yield to shareholders | 0.04% | ⬤ Free cash flow yield is very low. |
| EV/EBITDA (TTM) | Enterprise value to operating profit before depreciation and amortisation | 21.25 | ⬤ On an EBITDA basis, the valuation appears elevated, but not unusual for a company of this scale. |
| EV/EBIT (TTM) | Enterprise value to operating profit | 33.25 | ⬤ The shares trade at a high price relative to current operating profit. |
| P/B | Price to book value | 6.48 | ⬤ The premium to equity remains high. |
| Forward P/E | Forward price-to-earnings (P/E) ratio | 32.00 | ⬤ On forward earnings, the valuation appears moderate for a business of this quality. |
| Net Debt/EBITDA | Debt burden relative to EBITDA | -0.18 | ⬤ The company holds a net cash position and maintains low leverage. |
| Interest Coverage (TTM) | Ability to cover interest expenses with operating profit | 33.72 | ⬤ Interest expenses are covered with a substantial margin of safety. |
Conclusion on the valuation multiples for Amazon.com, Inc.
For a conservative investor, Amazon appears to be a very strong business, but without a clear valuation discount. On a net income and forward earnings basis, the multiples appear relatively moderate, considering the company’s scale, business quality, and the growth rates of AWS and advertising. However, on an operating profit basis – and especially on a free cash flow basis – the shares already appear expensive. At the same time, with respect to FCF, it is important to note that the current weakness is driven by very substantial investment in infrastructure and AI.
Over the next year, the decisive factors for Amazon shares will be the trajectory of AWS, margins, and free cash flow. If FCF begins to recover, the company’s valuation will appear significantly healthier. If not, the risk of a correction due to multiple compression remains elevated.
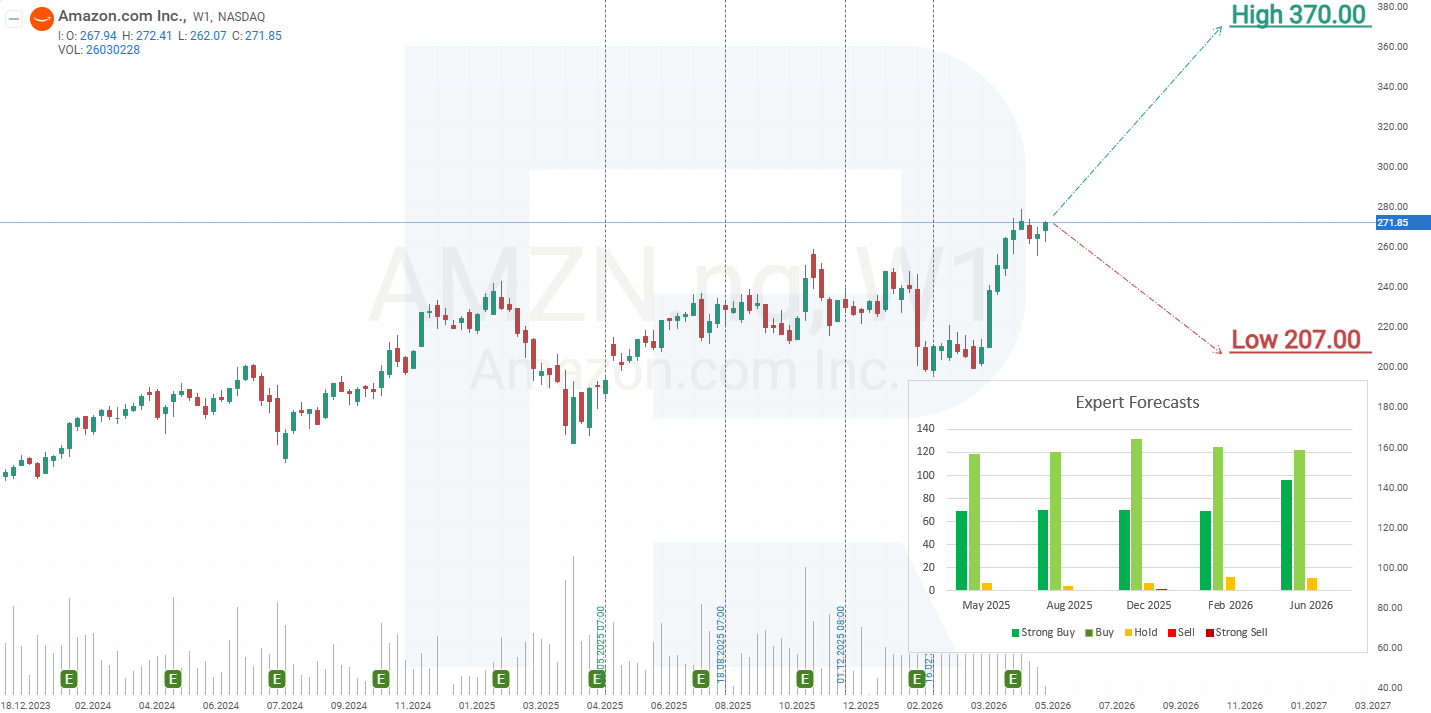
Expert forecasts for Amazon.com shares for 2026
- Barchart: 49 out of 57 analysts rated Amazon shares as Strong Buy, 5 as Moderate Buy, and 3 as Hold. The upper price target is 370 USD, and the lower bound is 230 USD.
- MarketBeat: 57 out of 60 analysts assigned a Buy rating, and 3 recommended Hold. The upper price target is 370 USD, and the lower bound is 218 USD.
- TipRanks: 45 out of 46 analysts assigned a Buy rating, and 1 recommended Hold. The upper price target is 370 USD, and the lower bound is 250 USD.
- Stock Analysis: 47 out of 66 analysts rated the shares as Strong Buy, 15 as Buy, and 4 as Hold. The upper price target is 370 USD, and the lower bound is 207 USD.
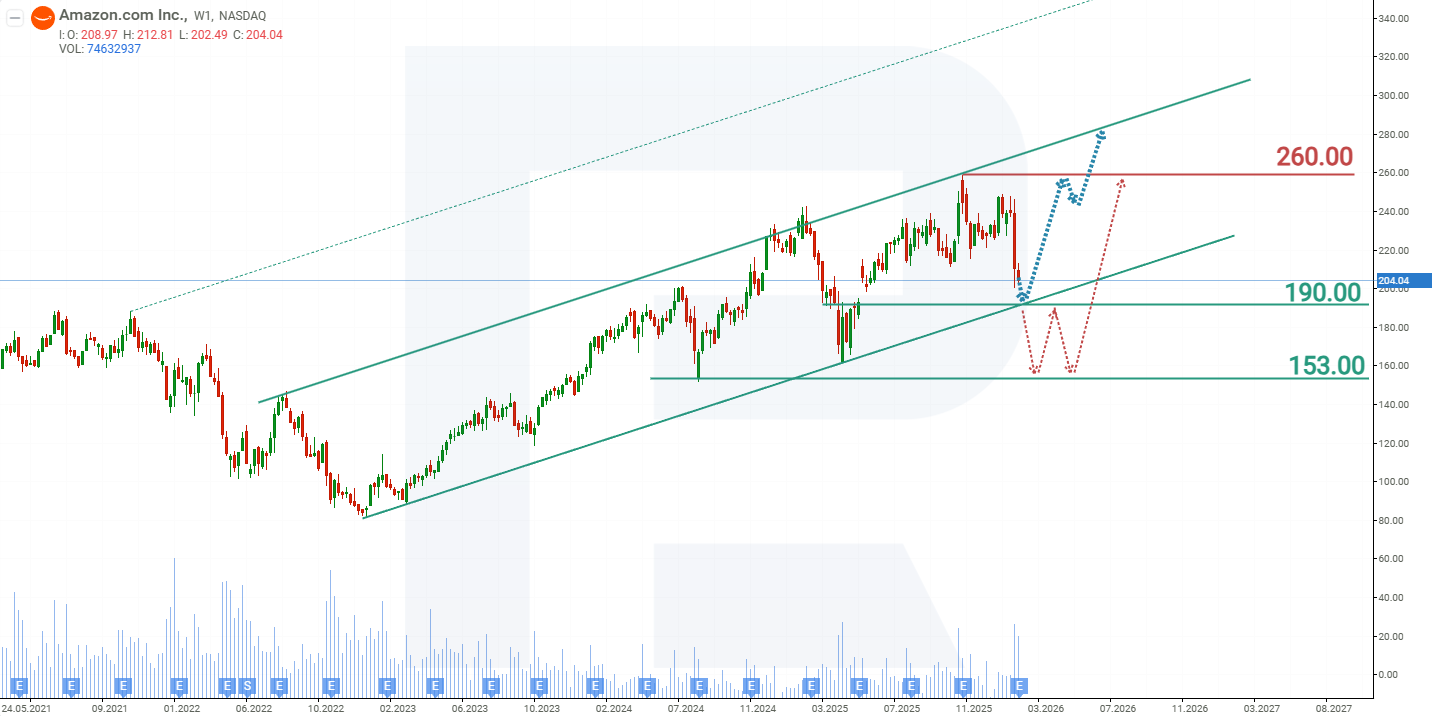
Amazon.com, Inc. stock price forecast for 2026
On the weekly chart, Amazon.com (AMZN) shares are trading above the 200-period moving average, indicating that the broader uptrend remains intact. However, the price is already testing the upper boundary of the channel, which is acting as resistance, while the Stochastic indicator is in overbought territory. Based on the current price dynamics of Amazon.com shares, the potential scenarios for 2026 are as follows.
The primary forecast for AMZN shares assumes a pullback towards support at 250 USD, where the correction is expected to conclude, followed by a renewed advance targeting 350 USD.
The alternative forecast for AMZN shares assumes continued upside without a corrective phase. In this scenario, a breakout above the upper boundary of the channel is expected, followed by a move higher towards 350 USD.
Ang mga pagtataya na ipinakita sa seksyong ito ay nagpapakita lamang ng pribadong opinyon ng may-akda at hindi dapat ituring bilang gabay para sa pagtetrade. Walang pananagutan ang RoboForex para sa mga resulta ng pagtetrade batay sa mga rekomendasyon sa pagtetrade na inilarawan sa mga analytical review na ito.