
Apple stock forecast: AAPL shares could climb towards 380 USD as earnings continue to grow
Apple increased revenue by 16%, while earnings per share rose by 29%. At the same time, AAPL stock continues to trade within an established uptrend. Technical analysis points to the potential for a move towards 380 USD, although the outlook remains sensitive to any slowdown in Apple's business.
Apple Inc. (NASDAQ: AAPL) reported stronger-than-expected results for the third quarter of its 2026 financial year. Revenue increased by 16% to 109.4 billion USD, while earnings per share reached 2.02 USD, driven by strong iPhone and Mac sales, continued growth in the services business, and record operating cash flow.
However, the company's guidance was cautious. For the next quarter, Apple expects revenue growth to slow to 9–11%, a gross margin of 47–48%, and operating expenses of 19.1–19.4 billion USD. Results are expected to come under pressure from currency movements, higher memory costs, and supply constraints affecting the iPhone, Mac, and iPad.
Following the earnings release, Apple shares fell by more than 7%. Investors were disappointed by the sharp slowdown in expected growth, while the strong gross margin reported for the current quarter was partly supported by one-off tariff refunds. The market is also concerned that rising component costs and ongoing supply constraints will continue to weigh on Apple's profitability over the coming quarters.
This article examines Apple Inc.'s business, provides a fundamental analysis of Apple's financial results, reviews the performance of AAPL stock through technical analysis, and presents a forecast for Apple stock for 2026.
About Apple Inc.
Apple Inc. is a US company founded in 1976 by Steve Jobs, Stephen Wozniak, and Ronald Wayne. Initially, it focused on manufacturing personal computers but later expanded its operations to become the leader in the consumer electronics industry. Apple is renowned for its innovative devices – the iPhone, iPad, Mac, Apple Watch, and AirPods – and its unique ecosystem, which integrates these products into its existing services.
Apple went public on the NASDAQ on 12 December 1980 under the AAPL ticker symbol. The company raised approximately 100 million USD, marking it as one of the largest and most successful initial public offerings of its time.
Consistent investor demand drove up Apple’s share value, eventually limiting the number of participants who could afford them. As a result, the company has conducted four stock splits in its history, each time lowering the share value and increasing the number of shares. In 1980, there were approximately 4.6 million shares in circulation; by 2024, this figure had exceeded 15 billion.
In addition to investor demand, Apple generates market demand for its stock through share buybacks. This strategy enables the company to reduce the total number of outstanding shares, thereby increasing earnings per share for the remaining stock and making the securities more appealing to investors. Since Apple introduced its share buyback program in 2012, it has allocated approximately 700 billion USD to this initiative, making it one of the world’s leading companies in terms of buyback volume, surpassing major corporations across other sectors.
The stock buyback is financed through free cash flow and low-interest loans.

Apple Inc.’s main revenue streams
In 2025, the company’s revenue came from the following streams:
- iPhone: the primary source of income, generating about half of the company’s total revenue due to its popular smartphone models.
- iPad and Mac: earnings from tablet and computer sales for both personal and business use. Although their share of total revenue has declined, they remain a vital part of Apple’s business model.
- Wearables, Home and Accessories: revenue from sales of Apple Watch, AirPods, and other accessories, including MagSafe and apps for iPhone, Mac, and iPad.
- Services: a rapidly expanding area that includes subscriptions to Apple Music, Apple TV+, iCloud, App Store, and other services. Services have become one of the company’s most profitable revenue streams.
- Financial services: Apple continues to enhance its financial products, including Apple Pay and the Apple Card, and expanded its presence in this segment in 2024.
- Products for businesses and corporate services: Apple offers a range of devices and services tailored for corporate clients, including businesses, educational institutions, and healthcare organisations.
Conclusion: based on the above, Apple generates revenue from manufacturing and selling hardware devices, as well as earning from digital service subscriptions and commissions on App Store transactions.
Apple Inc. Q4 2024 financial results
Apple reported strong Q4 2024 financial results. Below are the key figures from the report:(https://investor.apple.com/investor-relations/default.aspx):
- Revenue: 94.93 billion USD (+6%)
- Net income: 14.73 billion USD (–36%)
- Earnings per share: 0.97 USD (–34%)
- Operating profit: 29.59 billion USD (+9%)
Revenue by segment:
- iPhone: 46.22 billion USD (+5%)
- Mac: 7.74 billion USD (+2%)
- iPad: 6.95 billion USD (+8%)
- Wearables, Home and Accessories: 9.04 billion USD (–3%)
- Services: 24.97 billion USD (+12%)
Revenue by region:
- Americas: 41.66 billion USD (+4%)
- Europe: 24.92 billion USD (+11%)
- Greater China: 15.03 billion USD (–1%)
- Japan: 5.92 billion USD (+8%)
- Rest of Asia Pacific: 7.38 billion USD (+16%)
Nearly all metrics, except results from the Wearables, Home and Accessories segments, demonstrated growth. However, the company’s net profit still dropped by 36%. This decline was due to a 10.2 billion USD fine imposed by the European Union. Excluding this one-off payment, the net profit growth in Q4 2024 would have been 8%.
The company provided a conservative forecast for the next quarter. Revenue is expected to grow in the low to mid-single digits year-on-year, service income is anticipated to reach double-digit figures, and gross profit is forecast to be 46–47%, 1–2% higher than the previous quarter.
Apple Inc. Q1 2025 financial results
Apple released its Q1 2025 financial results on 30 January 2025. The key report data is outlined below: (https://investor.apple.com/investor-relations/default.aspx):
- Revenue: 124.30 billion USD (+4%)
- Net income: 36.33 billion USD (+7%)
- Earnings per share: 2.40 USD (+10%)
- Operating profit: 42.83 billion USD (+6%)
Revenue by segment:
- iPhone: 69.13 billion USD (–1%)
- Mac: 8.99 billion USD (+15%)
- iPad: 8.09 billion USD (+15%)
- Wearables, Home and Accessories: 11.75 billion USD (–2%)
- Services: 26.34 billion USD (+14%)
Revenue by region:
- Americas: 52.44 billion USD (+4%)
- Europe: 33.86 billion USD (+11%)
- Greater China: 18.51 billion USD (–11%)
- Japan: 8.98 billion USD (+15%)
- Rest of Asia Pacific: 10.29 billion USD (+1%)
In Q1 2025, Apple delivered record results. Total revenue increased by 4% to 124.3 billion USD, while earnings per share rose by 10% to 2.40 USD, exceeding analysts' expectations.
Performance across the company's business segments was mixed. iPhone revenue declined slightly, while Mac and iPad revenue increased following updates to their product line-ups. The Wearables, Home and Accessories segment recorded a decline, while the Services business continued to grow strongly, driven by the App Store, Apple Music, iCloud, and AppleCare.
Greater China remained the company's weakest region, with revenue declining by 11% due to intense local competition and geopolitical risks. Growth in other regions partly offset this decline, confirming the resilience of Apple's business.
For the second quarter of the 2025 financial year, Apple expected revenue growth in the low-to mid-single-digit percentage range, implying revenue of approximately 98–100 billion USD. Services revenue was also expected to grow in the low-single-digit range.
Apple Inc. Q2 2025 financial results
Apple released its Q2 2025 financial results on 1 May 2025. Below are the key figures from the report compared with the same period in 2024: (https://investor.apple.com/investor-relations/default.aspx):
- Revenue: 95.35 billion USD (+5%)
- Net income: 24.78 billion USD (+5%)
- Earnings per share: 1.65 USD (+8%)
- Operating profit: 29.58 billion USD (+6%)
Revenue by segment:
- Net sales – Products: 68.71 billion USD (+3%)
- Net sales – Services: 26.65 billion USD (+12%)
- iPhone: 46.84 billion USD (+2%)
- Mac: 7.95 billion USD (+7%)
- iPad: 6.40 billion USD (+15%)
- Wearables, Home and Accessories: 7.52 billion USD (–5%)
Revenue by region:
- Americas: 40.31 billion USD (+8%)
- Europe: 24.45 billion USD (+1%)
- Greater China: 16.00 billion USD (–2%)
- Japan: 7.30 billion USD (+16%)
- Rest of Asia Pacific: 7.29 billion USD (+8%)
Apple reported steady growth in the second quarter of its 2025 financial year but also faced new risks. Revenue increased by 5% year-on-year to 95.4 billion USD, while earnings per share rose by 8% to 1.65 USD.
The Services business remained the main growth driver. Segment revenue increased by 12% to a record 26.65 billion USD, while the number of paid subscriptions exceeded 1 billion. iPhone revenue increased by 2% to 46.84 billion USD despite weaker sales in Greater China, which were offset by growth in the Americas and Japan.
The main risks stemmed from potential US tariffs, legal pressure on the App Store, and delays to the updated version of Siri. Apple estimated that tariffs could reduce profit by approximately 900 million USD in the third quarter of the 2025 financial year, prompting the company to accelerate the relocation of part of its manufacturing from China to India.
For Q3 2025, Apple forecast revenue growth in the low-to mid-single-digit percentage range and a gross margin of 45.5–46.5%. Additional support for shareholders came from a new 110 billion USD share buyback program and a 4% increase in the quarterly dividend to 0.26 USD per share.
Apple Inc. Q3 2025 financial results
Apple released its Q3 2025 financial results on 31 July 2025. Below are the key figures compared to the same period in 2024: (https://investor.apple.com/investor-relations/default.aspx):
- Revenue: 94.03 billion USD (+10%)
- Net income: 23.43 billion USD (+10%)
- Earnings per share: 1.57 USD (+12%)
- Operating profit: 28.20 billion USD (+11%)
Revenue by segment:
- Net sales – Products: 66.61 billion USD (+8%)
- Net sales – Services: 27.42 billion USD (+13%)
- iPhone: 44.58 billion USD (+13%)
- Mac: 8.05 billion USD (+15%)
- iPad: 6.58 billion USD (–8%)
- Wearables, Home and Accessories: 7.40 billion USD (–8%)
Revenue by region:
- Americas: 41.20 billion USD (+9%)
- Europe: 24.01 billion USD (+10%)
- Greater China: 15.37 billion USD (+4%)
- Japan: 5.78 billion USD (+13%)
- Rest of Asia Pacific: 7.67 billion USD (+20%)
Apple’s Q3 2025 financial report set a record for this period. Revenue rose to 94 billion USD, up 10% year-on-year and exceeding consensus expectations. Net income reached 23.4 billion USD, while earnings per share grew 12% year-on-year to 1.57 USD. iPhone sales increased by 13% to 44.6 billion USD, with services reaching an all-time high of 27.4 billion USD.
Apple management issued an optimistic outlook for the next reporting period. For Q4 2025, total revenue growth was projected to be in the mid- to high-single-digit range compared with the previous year. The gross margin was expected to remain within the 46–47% range, despite the company setting aside nearly 1.1 billion USD for new tariffs.
Apple Inc. Q4 2025 financial results
On 30 October 2025, Apple released its Q4 2025 financial results. The key figures compared with the same period of fiscal 2024 are as follows:
- Revenue: 102.47 billion USD (+8%)
- Net income: 27.47 billion USD (+10%)*
- Earnings per share (EPS): 1.85 USD (+13%)*
- Operating profit: 32.43 billion USD (+10%)
Revenue by segment:
- Net sales – Products: 73.72 billion USD (+5%)
- Net sales – Services: 28.75 billion USD (+15%)
- iPhone: 49.03 billion USD (+6%)
- Mac: 8.73 billion USD (+13%)
- iPad: 6.95 billion USD (0%)
- Wearables, Home and Accessories: 9.01 billion USD (0%)
Revenue by region:
- Americas: 44.19 billion USD (+6%)
- Europe: 28.70 billion USD (+15%)
- Greater China: 14.49 billion USD (−4%)
- Japan: 6.64 billion USD (+12%)
- Rest of Asia Pacific: 8.44 billion USD (+14%)
*Growth in net income and EPS is calculated on a non-GAAP basis, with 2024 adjusted for the one-off EC tax penalty.
Apple completed Q4 2025 with strong results. Revenue increased by 8% year-on-year, while adjusted earnings per share rose by 13% year-on-year, excluding a one-off EU tax penalty. The company delivered record September-quarter revenue, record iPhone revenue, and record earnings per share, while full-year revenue reached approximately 416 billion USD. The gross margin increased to 47.2%, indicating that Apple maintained strong profitability despite tariff-related pressure and investment in new growth areas.
Growth was well balanced. iPhone revenue reached approximately 49 billion USD following the launch of the iPhone 17 lineup, although the quarter included only the first week of sales of the new models. Mac revenue increased to 8.7 billion USD, supported by the rollout of M5-based devices. The Services business once again was the main growth driver, with segment revenue reaching a record 28.8 billion USD, up approximately 15% year-on-year.
Greater China remained the weakest region, where revenue declined by approximately 4% due to competition from local brands and supply constraints. At the same time, sales grew strongly in emerging markets, including India, while the installed base of active devices reached a record high across all product categories.
Capital expenditure in Q4 increased by 35% to 12.7 billion USD, primarily due to investment in AI infrastructure, chips, and data centres. For Apple, this level of spending remained manageable thanks to strong cash flow and substantial liquidity. The key question was how quickly these AI investments would begin generating additional services revenue.
The guidance for the first quarter of the 2026 financial year was strong. Apple expected revenue growth of 10–12% year-on-year, double-digit growth in iPhone sales, and a gross margin of 47–48%. Management also expected Greater China to return to growth while expecting the Services business to continue delivering double-digit growth.
Apple Inc. Q1 2026 financial results
On 29 January 2025, Apple released its Q1 2026 financial results for the quarter ended 27 December 2025. Below are the key figures from the report compared to the same period in the 2025 financial year:
- Revenue: 143.75 billion USD (+16%)
- Net income: 42.10 billion USD (+15%)
- Earnings per share: 2.84 USD (+19%)
- Operating profit: 50.85 billion USD (+19%)
Revenue by segment:
- Net sales – Products: 113.74 billion USD (+16%)
- Net sales – Services: 30.01 billion USD (+14%)
- iPhone: 85.27 billion USD (+23%)
- Mac: 8.39 billion USD (–7%)
#. iPad: 8.60 billion USD (+6%)
- Wearables, Home, and Accessories: 11.49 billion USD (–2%)
Revenue by region:
- Americas: 58.53 billion USD (+11%)
- Europe: 38.15 billion USD (+12%)
- Greater China: 25.53 billion USD (+38%)
- Japan: 9.41 billion USD (+5%)
- Rest of Asia Pacific: 12.14 billion USD (+18%)
Apple delivered one of the strongest quarters in its history in Q1 2026. Record revenue and results that exceeded analysts' expectations confirmed resilient demand for the company's key products and the strength of its ecosystem.
The main growth driver was the iPhone, which delivered the strongest quarterly performance in the segment's history. The Services business also reached a new record, further strengthening the contribution of recurring, higher-margin revenue. Weaker performance in the Mac and Wearables, Home and Accessories segments did not appear critical, as the iPhone and Services businesses continued to make the largest contribution to the company's financial results.
Apple continued to generate strong operating cash flow, allowing the company to invest in future growth, pay dividends, and continue its share buyback program.
For Q2 2026, Apple expected revenue growth of 13–16% year-on-year and a gross margin of 48–49%. Management also forecast Services revenue growth broadly in line with the December quarter, at approximately 14% year-on-year. In the hardware business, growth was expected to moderate following the record iPhone quarter.
Overall, the guidance for Q2 remained strong, with Apple expecting double-digit revenue growth, high margins, and continued expansion of its Services business.
Apple Inc. Q2 2026 financial results
On 30 April 2026, Apple released its Q2 2026 financial results for the quarter ended 28 March 2026. The key figures compared with the same period of the 2025 financial year are as follows:
- Revenue: 111.18 billion USD (+16%)
- Net income: 29.58 billion USD (+19%)
- Earnings per share: 2.01 USD (+22%)
- Operating profit: 35.89 billion USD (+21%)
Revenue by segment:
- Net sales – Products: 80.21 billion USD (+17%)
- Net sales – Services: 30.98 billion USD (+16%)
- iPhone: 56.99 billion USD (+22%)
- Mac: 8.40 billion USD (+6%)
- iPad: 6.91 billion USD (+8%)
- Wearables, Home and Accessories: 7.90 billion USD (+5%)
Revenue by region:
- Americas: 45.09 billion USD (+12%)
- Europe: 28.06 billion USD (+15%)
- Greater China: 20.50 billion USD (+28%)
- Japan: 8.40 billion USD (+15%)
- Rest of Asia Pacific: 9.14 billion USD (+25%)
Apple delivered a strong second quarter of the 2026 financial year. Revenue increased by 17%, with the company setting new records for the March quarter for total revenue, iPhone sales, and earnings per share. Growth was recorded across all geographic segments, confirming resilient demand for Apple's products.
The iPhone once again was the main growth driver. Segment revenue increased by 22%, supported by strong demand for the iPhone 17 lineup. Performance was particularly strong in Greater China, where revenue increased by 28% following several challenging years for the company in that market.
Profitability remained high. The gross margin increased to 49.3%, operating profit rose by 21%, and operating cash flow totalled 28.7 billion USD. Apple also increased its quarterly dividend to 0.27 USD per share and approved a new 100 billion USD share buyback program.
For the third quarter of the 2026 financial year, Apple expected revenue growth of 14–17% year-on-year and a gross margin of 47.5–48.5%. The main risks were expected to come from supply constraints, rising memory costs, and investment in AI development.
Apple Inc. Q3 2026 financial results
On 30 July 2026, Apple published its financial results for the third quarter of the 2026 financial year, which ended on 27 June 2026. The key figures are presented below, compared with the corresponding period of the 2025 financial year:
- Revenue: 109.42 billion USD (+16%)
- Net income: 29.79 billion USD (+27%)
- Earnings per share: 2.02 USD (+29%)
- Operating profit: 35.70 billion USD (+27%)
Revenue by segment:
- Net sales Products: 78.68 billion USD (+18%)
- Net sales Services: 30.74 billion USD (+12%)
- iPhone: 54.25 billion USD (+22%)
- Mac: 10.35 billion USD (+29%)
- iPad: 6.19 billion USD (-6%)
- Wearables, Home and Accessories: 7.88 billion USD (+6%)
Revenue by region:
- Americas: 45.78 billion USD (+11%)
- Europe: 29.40 billion USD (+22%)
- Greater China: 18.82 billion USD (+22%)
- Japan: 6.55 billion USD (+13%)
- Rest of Asia Pacific: 8.87 billion USD (+16%)
Apple reported stronger-than-expected results for the third quarter of the 2026 financial year. Revenue reached a record 109.4 billion USD for the June quarter, increasing by 16% year-on-year, while earnings per share rose by 29% to 2.02 USD, exceeding the consensus forecast of 1.89 USD. Despite these strong results, Apple shares fell by 7.3% on the first trading day following the earnings release, as investors became concerned about the company's outlook for the autumn quarter.
The company met the guidance it issued in April. Revenue increased by 16%, while the gross margin reached 50.1%. However, approximately two percentage points of this improvement resulted from tariff refunds. Excluding this effect, the gross margin would have been approximately 48.1%. Operating expenses reached the upper end of the company's guidance at 19.1 billion USD due to increased investment in research and development.
For the September quarter, Apple expects revenue growth to slow to 9–11%. Results are expected to come under pressure from adverse currency movements and supply constraints affecting the iPhone, Mac, and iPad. The gross margin is forecast at 47–48%, while operating expenses are expected to increase to 19.1–19.4 billion USD.
For investors, the report sends mixed signals. The main driver of performance remained strong demand for the iPhone 17. Segment revenue increased by 22%, setting a June-quarter record. The iPhone also maintained its leading position in key markets, including the US, China, the UK, France, Australia, and Japan.
Mac revenue increased by 29%, driven by demand for the MacBook Neo and MacBook Pro, as well as an influx of new users. The Services business continued to deliver steady growth, with revenue increasing by 12%. The number of paid subscriptions exceeded 1.5 billion, while the installed base of active devices surpassed 2.5 billion. This expands Apple's ability to further monetise its ecosystem through services and new AI-powered features.
On the other hand, the report also contains several significant areas of concern. The most important is the rapidly rising cost of memory. Management explicitly warned that pricing pressure would persist beyond September, potentially affecting margins. Apple has already raised prices on many products since the end of June, including the MacBook Air and MacBook Neo, but has so far left iPhone 17 pricing unchanged, likely postponing any increase until the launch of the iPhone 18.
Another negative signal was the forecast for revenue growth to slow to 9–11% in the next quarter. Even allowing for favourable currency effects, the underlying growth rate is expected to moderate, pointing to a gradual loss of momentum.
At the same time, supply constraints are becoming more widespread. Previously, shortages primarily affected selected Mac models, but they are now extending to key product categories, including the iPhone, Mac, and iPad. This increases the risk that Apple may be unable to fully meet demand over the coming months.
Not all business segments are delivering consistent growth either. iPad revenue declined by 6% to 6.2 billion USD, although management attributed this to a strong comparison base following last year's launch of new models. Nevertheless, this performance suggests that the company's growth remains uneven.
Finally, an additional source of uncertainty is the upcoming leadership transition. This report marked Tim Cook's final earnings release as Chief Executive Officer. His successor, John Ternus, has yet to demonstrate his ability to lead Apple through a period of rising production costs, supply constraints, and increasing external pressure.
From a share price perspective, recent market performance suggests a shift from optimism to a more cautious assessment of Apple's prospects. Before the earnings release, the stock reached a new all-time high, while the company's market capitalisation exceeded 5 trillion USD intraday for the first time. This suggests that investors had already priced in almost flawless execution.
Although the reported results exceeded analysts' expectations, part of the positive performance was supported by one-off tariff refunds, while the guidance for the next quarter points to a gradual slowdown in growth. This creates the risk of further downward revisions to expectations, particularly given ongoing pressure on margins and persistent supply constraints.
Apple remains a high-quality company thanks to its exceptionally loyal customer base, record installed base, and resilient cash flow. However, in the near term, the stock may remain under pressure due to rising memory costs, higher production costs, and slowing revenue growth.
Analysis of key valuation multiples for Apple Inc.
The table below presents Apple Inc.'s key valuation multiples as of the end of Q3 2026, calculated using a stock price of 310 USD.
| Multiple | What it indicates | Value | Commentary |
|---|---|---|---|
| P/E (TTM) | Price paid for 1 USD of earnings over the past 12 months | 35.10 | ⬤ The valuation appears expensive relative to earnings |
| P/S (TTM) | Price paid for 1 USD of annual revenue | 9.70 | ⬤ The valuation remains very high relative to revenue |
| EV/Sales (TTM) | Enterprise value to sales, accounting for debt | 9.56 | ⬤ Even after accounting for Apple’s capital structure, the valuation remains high |
| P/FCF (TTM) | Price paid for 1 USD of free cash flow | 33.11 | ⬤ The valuation appears high relative to free cash flow |
| FCF Yield (TTM) | Free cash flow yield to shareholders | 3.02% | ⬤ The free cash flow yield appears moderate |
| EV/EBITDA (TTM) | Enterprise value to operating profit before depreciation and amortisation | 26.58 | ⬤ The valuation appears demanding for a large, mature company |
| EV/EBIT (TTM) | Enterprise value to operating profit | 28.83 | ⬤ The valuation appears high relative to operating profit |
| P/B | Price to book value | 42.09 | ⬤ The price-to-book ratio remains very high, although it is partly distorted by Apple's substantial share buybacks |
| Forward P/E | Forward price-to-earnings (P/E) ratio | 33.3 | ⬤ The valuation also appears expensive based on forward earnings |
| Net Debt/EBITDA | Debt burden relative to EBITDA | –0.37 | ⬤ The company has a net cash position and a strong balance sheet |
| Interest Coverage (TTM) | Ability to cover interest expenses with operating profit | n/a | ⬤ Apple does not disclose interest expense separately in a format that allows a direct calculation of interest coverage |
Conclusion from Apple Inc.'s valuation multiples
Apple appears to be an expensive but still compelling growth stock. Based on its current valuation multiples, the stock trades at a significant premium. A P/E ratio of more than 35x, a P/FCF multiple above 33x, an EV/EBITDA multiple exceeding 26x, and a forward P/E of around 33x indicate that the market is already pricing in strong future performance and is willing to pay a premium for Apple's resilient business, powerful brand, cash generation, and ecosystem.
However, a high valuation is not necessarily a reason to avoid the stock altogether. Apple continues to maintain a strong balance sheet, a net cash position, and substantial free cash flow. This enables the company to continue its share buyback program, invest in new products, and support further growth in earnings per share. If the business maintains its positive momentum and new products and services make a meaningful contribution to revenue growth, the current premium may remain justified.
Overall, Apple can be viewed as an investment in the continued growth of a high-quality technology company. However, the stock may offer a more attractive entry point following a correction.
Expert forecasts for Apple Inc. shares in 2026
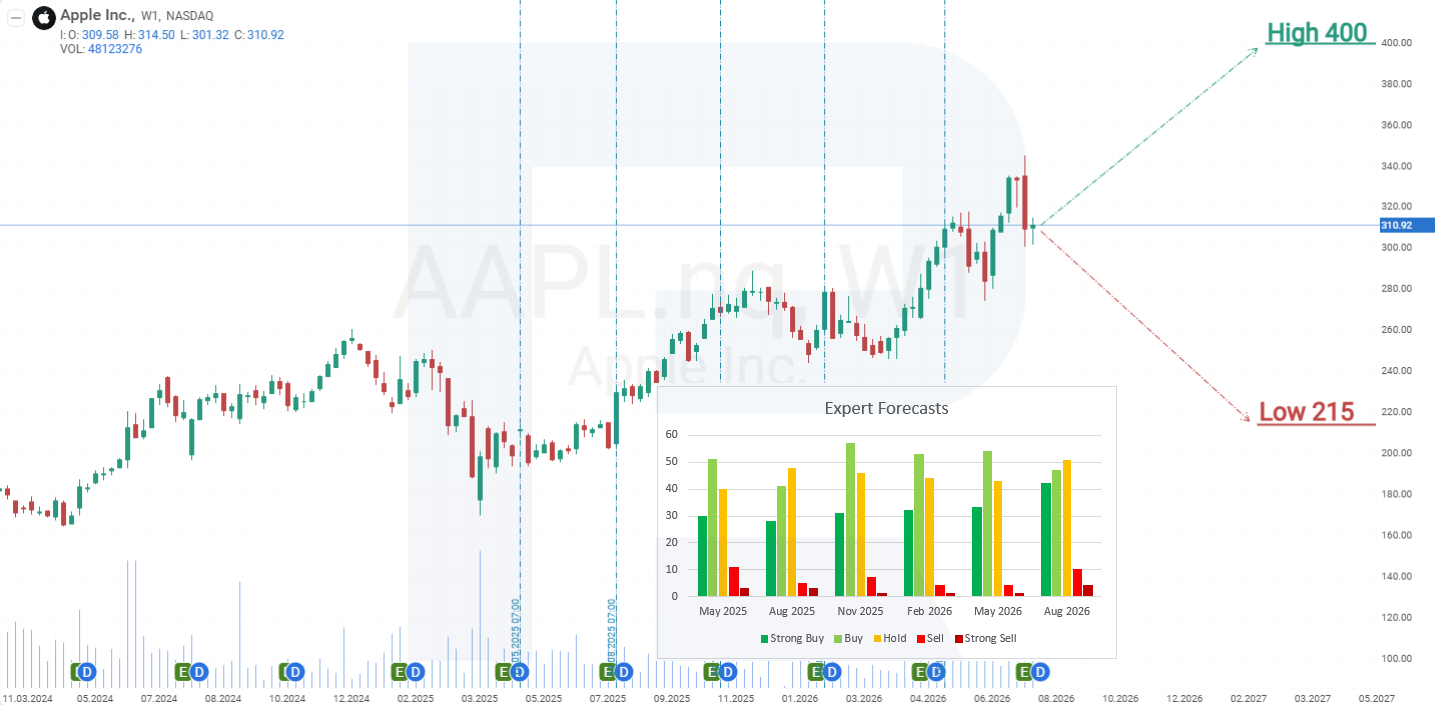
- Barchart: 21 of 42 analysts rate Apple stock as Strong Buy, 3 as Moderate Buy, 15 as Hold, 1 as Sell, and 2 as Strong Sell. The highest price target is 400 USD, while the lowest is 235 USD.
- MarketBeat: 22 of 36 analysts rate the stock as Buy, 11 as Hold, and 3 as Sell. The highest price target is 400 USD, while the lowest is 200 USD.
- TipRanks: 16 of 30 analysts rate the stock as Buy, 11 as Hold, and 3 as Sell. The highest price target is 400 USD, while the lowest is 245 USD.
- Stock Analysis: 21 of 46 analysts rate Apple stock as Strong Buy, 6 as Buy, 14 as Hold, 3 as Sell, and 2 as Strong Sell. The highest price target is 400 USD, while the lowest is 215 USD.
Overall, analysts' forecasts for Apple stock remain positive. Across all four platforms, most analysts recommend buying or holding the stock, while sell recommendations account for only a small proportion of the total. In addition, the highest price target published by Barchart, MarketBeat, TipRanks, and Stock Analysis is consistently 400 USD, indicating continued upside potential if Apple's business continues to perform well.
Technical analysis and 2026 forecast for Apple Inc. stock
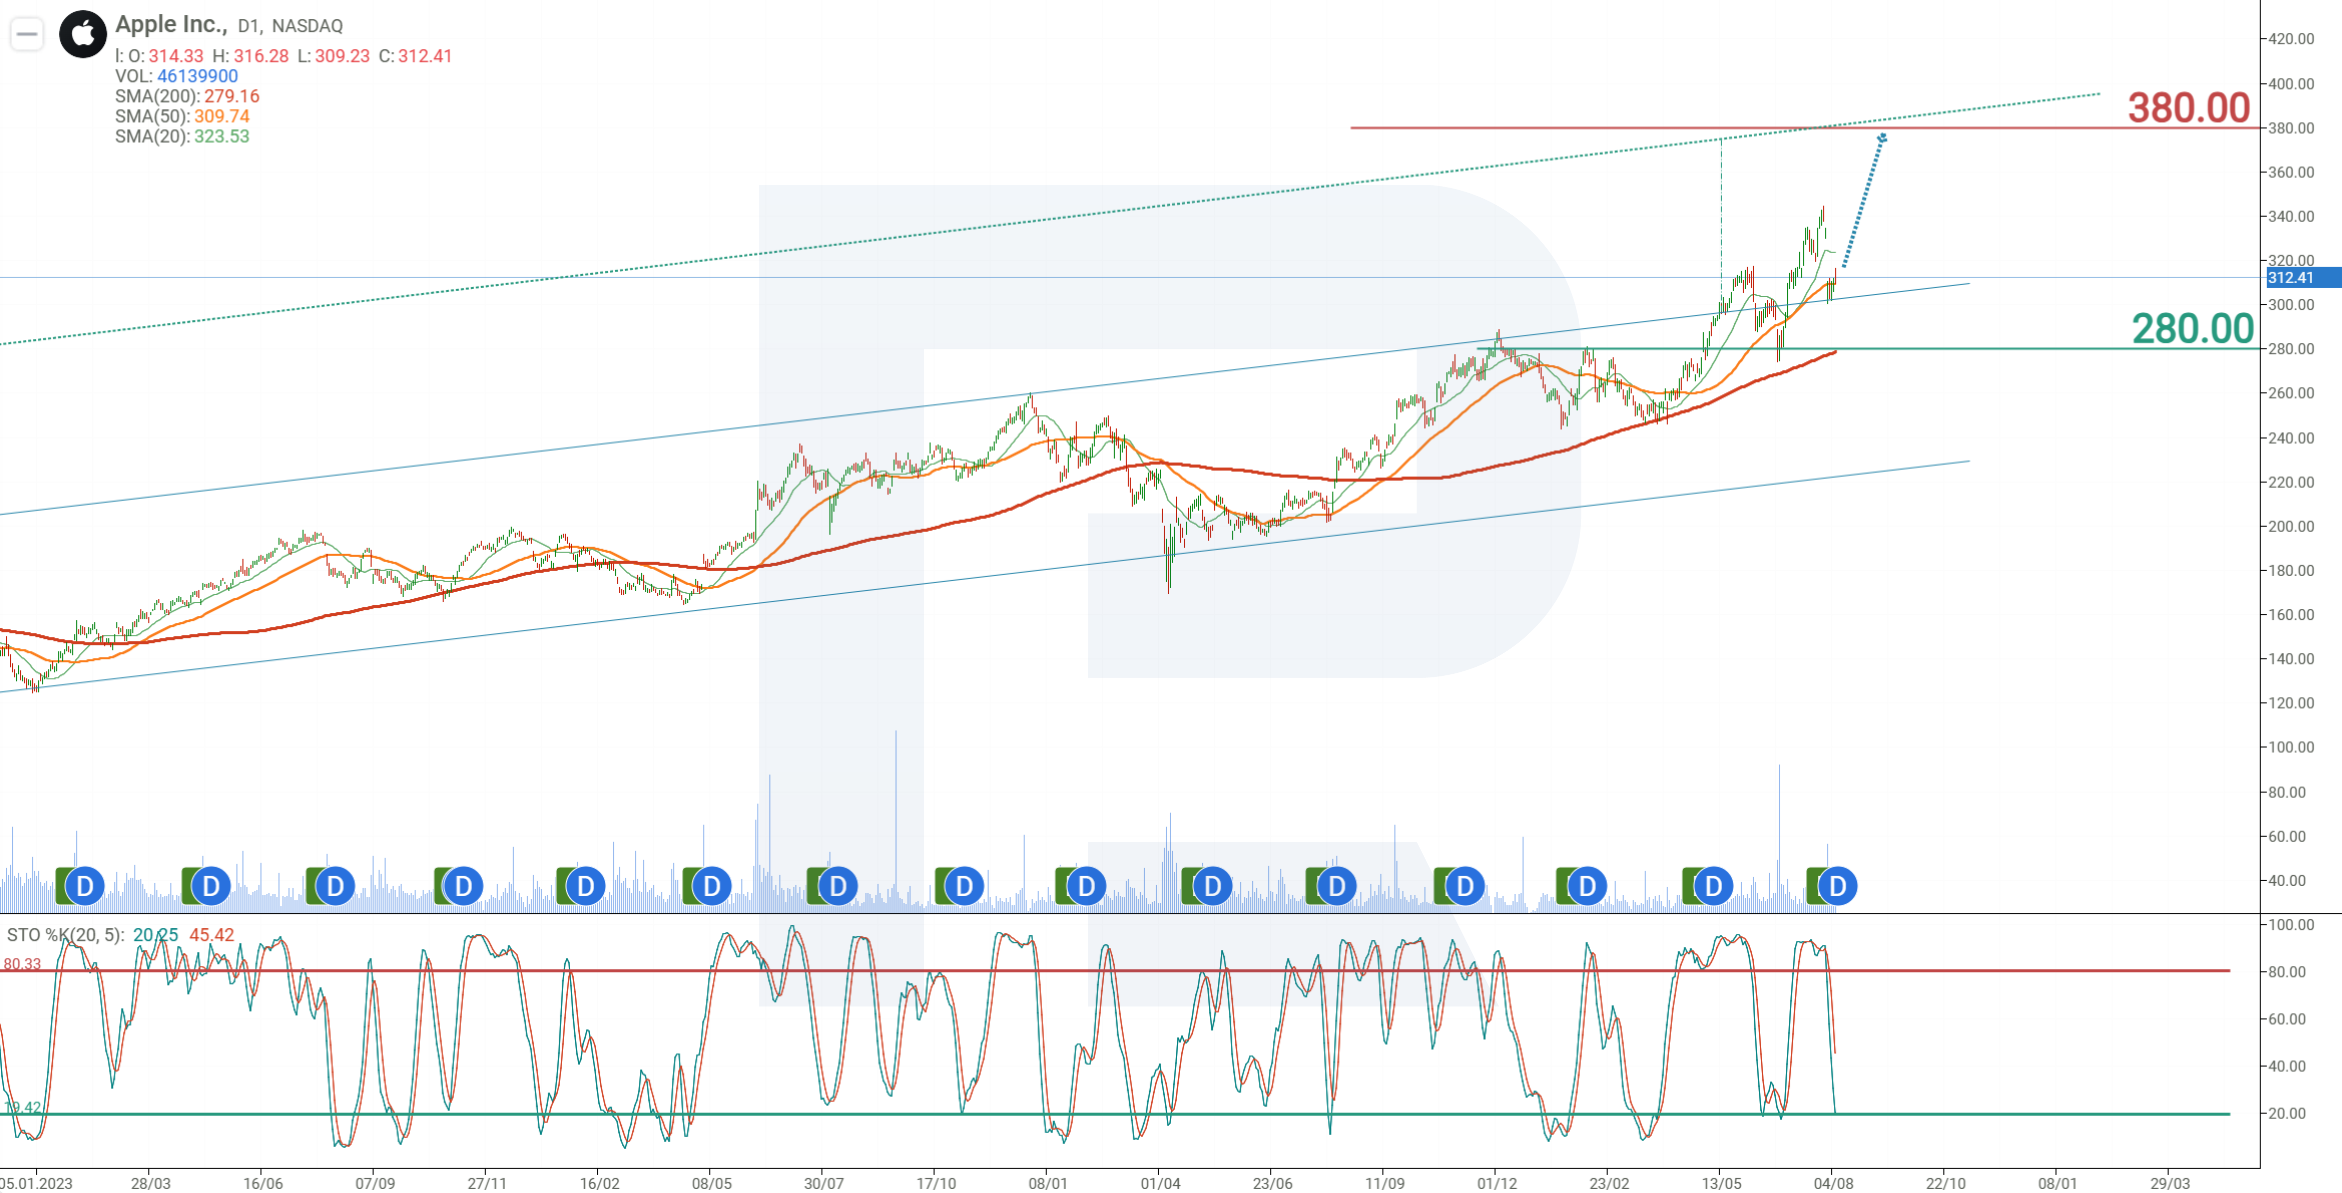
On the daily chart, Apple stock continues to trade above the 200-period Moving Average, indicating that the prevailing trend remains bullish. The Stochastic indicator is approaching oversold territory, increasing the likelihood that the current correction is nearing completion and that the stock will resume its uptrend. An additional positive signal is the breakout above the upper boundary of the ascending channel. This creates upside potential equivalent to the width of the channel, pointing to a price target of 380 USD. Based on the current Apple stock performance, the following scenarios outline its potential movement in 2026:
The forecast for AAPL stock suggests continued gains towards resistance at 380 USD. However, if the stock falls below 280 USD, it would break below the 200-period Moving Average. This would invalidate the bullish scenario, as the likelihood of a deeper correction would increase.
Position management: Once the stock has moved 6% in the projected direction, the Stop Loss should be moved to the entry level. The protective stop should then be adjusted to remain 6% below the price.
Ang mga pagtataya na ipinakita sa seksyong ito ay nagpapakita lamang ng pribadong opinyon ng may-akda at hindi dapat ituring bilang gabay para sa pagtetrade. Walang pananagutan ang RoboForex para sa mga resulta ng pagtetrade batay sa mga rekomendasyon sa pagtetrade na inilarawan sa mga analytical review na ito.