
JPMorgan shares retain upside potential following Q3 2026 results
JPMorgan continues to increase net interest income and lending, but rising expenses are limiting profit growth. A strong 2027 outlook supports JPM shares, while a break above the 344 USD resistance level could signal further upside.
JPMorgan Chase & Co. (NYSE: JPM) ended Q3 2026 with growth across its key business areas. Revenue increased 8% to 50.9 billion USD, while earnings per share came in at 5.57 USD. Excluding a significant one-off loss, EPS was 5.75 USD, which was below analysts’ expectations. Higher net interest income, increased lending, and lower credit losses supported the results. At the same time, personnel, technology, and marketing expenses grew faster than revenue, limiting profit growth.
The bank expects around 107 billion USD in net interest income in 2027, 10% above the comparable 2026 guidance.
This article provides an overview of JPMorgan Chase & Co. and a fundamental analysis of JPM shares. It reviews the bank’s quarterly results, allowing you to compare its financial performance across periods. It also examines JPMorgan Chase & Co. stock performance and provides a technical analysis of JPM, which forms the basis for a JPMorgan Chase & Co. stock forecast for the second half of 2026.
About JPMorgan Chase & Co.
JPMorgan Chase & Co. traces its origins to the Bank of the Manhattan Company, founded in 1799. The modern conglomerate was shaped by a long history of consolidation, culminating in the 2000 merger between Chase Manhattan Corporation and J.P. Morgan & Co. The company did not undergo an IPO, as it was formed through successive mergers and acquisitions. Nevertheless, JPMorgan Chase shares are listed on the New York Stock Exchange under the ticker symbol JPM.
JPMorgan Chase provides a broad range of financial services, including investment and commercial banking, retail banking services, asset and wealth management, and risk and payment management solutions. It is the largest US bank by assets and one of the leading investment, commercial, and retail banking institutions. Globally, the company holds a prominent position in investment and financial services and is classified as a systemically important financial institution.

JPMorgan Chase & Co.’s main sources of revenue
JPMorgan Chase & Co.’s revenue comes from several key sources:
- Consumer & Community Banking: the largest revenue segment, comprising income from retail banking, including interest on loans and deposits, credit card fees, ATM charges, and other banking services for individuals and small businesses.
- Corporate & Investment Bank: revenue generated from investment banking services, such as commissions on stock and bond offerings, advisory fees for mergers and acquisitions, and income from capital markets trading activities, including fixed income and equities.
- Commercial Banking: income from services provided to medium and large businesses, including loans, cash flow management, and other commercial banking services.
- Asset & Wealth Management: revenue from managing investments for institutional and individual clients, including asset management fees, withdrawals from deposit accounts, and other investment-related income.
- Net Interest Income: profit derived from the difference between interest earned on loans and investments and interest paid on deposits.
JPMorgan Chase’s revenue is highly diversified across a wide range of financial services, from retail to investment banking. This diversification enables the bank to maintain a stable revenue stream even amid changing market conditions.
JPMorgan Chase & Co. Q3 2024 financial results
Banks are traditionally the first to report earnings at the end of each quarter. JPMorgan Chase & Co.’s Q3 2024 results are outlined below, compared with the corresponding period in 2023:
- Revenue: 43.3 billion USD (+6%)
- Net Income: 12.9 billion USD (–2%)
- Earnings per Share (EPS): 4.37 USD (+1%)
- Net Interest Income: 23.5 billion USD (+3%)
- Consumer & Community Banking revenue: 17.8 billion USD (–3%)
- Commercial & Investment Bank revenue: 17.0 billion USD (+8%)
- Asset & Wealth Management revenue: 5.4 billion USD (+9%)
- Corporate Revenue: 3.1 billion USD (+97%)
- Assets under Management: 3.9 trillion USD (+23%)
- Client Assets: 5.7 trillion USD (+23%)
In its commentary on the results, JPMorgan Chase’s management emphasised that the bank continues to deliver stable performance despite a challenging economic environment. Q3 2024 revenue exceeded expectations, although net income declined slightly due to higher provisions for credit losses. CFO Jeremy Barnum noted that consumers remain in a strong financial position and that the increase in provisions was driven by growth in the loan portfolio rather than any deterioration in credit quality.
The bank anticipated a gradual decline in net interest income (NII) during Q4 2024, potentially reaching a trough in mid-2025, followed by a recovery supported by loan portfolio expansion and higher credit card turnover. The bank identified the deteriorating geopolitical landscape, the sizable US budget deficit, and changes to existing trade agreements as potential risks.
JPMorgan Chase & Co. Q4 2024 financial results
JPMorgan Chase & Co. released its Q4 2024 results on 15 January 2025. As forecast by the bank’s management, quarterly net interest income declined by 2%. Key highlights of the report are outlined below in comparison with the corresponding period in 2023:
- Revenue: 42.8 billion USD (+11%)
- Net Income: 14.0 billion USD (+50%)
- Earnings Per Share (EPS): 4.81 USD (+58%)
- Net Interest Income: 23.0 billion USD (–2%)
- Consumer & Community Banking revenue: 18.4 billion USD (–6%)
- Commercial & Investment Bank revenue: 17.6 billion USD (+18%)
- Asset & Wealth Management revenue: 5.8 billion USD (+13%)
- Corporate Revenue: 2.0 billion USD (+13%)
- Assets under Management: 4.0 trillion USD (+18%)
- Client Assets: 5.9 trillion USD (+18%)
The bank’s Chair and CEO, Jamie Dimon, noted that all business segments performed strongly. The Corporate and Investment Bank (CIB) saw strong client activity. There was also a double-digit increase in payment fees for four consecutive quarters, contributing to a record annual payment income. Retail banking continued to attract new clients across all areas, from consumer banking to asset management, resulting in nearly two million new accounts opening in 2024.
Dimon noted that the bank maintains a resilient balance sheet, including a loss-absorbing capacity of 547 billion USD and 1.4 trillion USD in cash and marketable securities. He assessed the US economy as steady, with a low unemployment rate and stable consumer spending. However, he highlighted two main risks: the potentially inflationary effects of future expenditure and geopolitical instability.
JPMorgan Chase & Co. projected net interest income (excluding markets) of approximately 90 billion USD in 2025, a decrease of 2 billion USD compared to 2024.
The bank anticipated expenses of approximately 95.0 billion USD, representing an increase of 3.9 billion USD compared with 2024. The rise in costs was attributed by management to inflation.
JPMorgan Chase & Co. Q1 2025 financial results
On 11 April 2025, JPMorgan Chase & Co. published its Q1 2025 financial results. The key figures compared with the same period in 2024 are presented below:
- Revenue: 45.3 billion USD (+8%)
- Net Income: 14.6 billion USD (+9%)
- Earnings Per Share (EPS): 5.07 USD (+14%)
- Net Interest Income: 23.4 billion USD (+1%)
- Consumer & Community Banking Revenue: 18.3 billion USD (+4%)
- Commercial & Investment Bank Revenue: 19.7 billion USD (+12%)
- Asset & Wealth Management Revenue: 5.7 billion USD (+12%)
- Corporate Revenue: 2.3 billion USD (+5%)
- Assets Under Management: 4.1 trillion USD (+15%)
- Client Assets: 6.0 trillion USD (+15%)
JPMorgan Chase & Co. reported strong Q1 2025 results, exceeding Wall Street expectations. Investment banking and trading were the main growth drivers, with investment banking fees rising 12% and trading revenue increasing 21%, including a record 3.8 billion USD in equities trading revenue.
From January to April 2025, JPM shares fell more than 5% despite the strong quarterly results, reflecting market caution. However, several factors supported the case for long-term investment.
First, JPMorgan remains a systemically important bank with a global network, resilient cash flow, and a diversified business model. It is one of the few banks that can generate earnings across different phases of the economic cycle, whether in expansion, stagnation, or recession.
Second, JPM’s dividend yield has remained consistently high, standing at around 2.5–3% annually as of April 2025. Management follows a strategy of regularly increasing dividend payments, making the shares attractive to income-focused investors.
Third, the bank actively buys back its own shares. In Q1 2025, JPMorgan Chase & Co. maintained an active capital return policy, repurchasing 7.1 billion USD of its shares.
JPMorgan Chase & Co. Q2 2025 financial results
On 15 July 2025, JPMorgan Chase & Co. published its Q2 2025 financial results. The key figures compared with the same period in 2024 are presented below:
- *Revenue: 45.7 billion USD (–10%)
- *Net Income: 15.0 billion USD (–17%)
- *Earnings Per Share (EPS): 5.24 USD (–14%)
- *Net Interest Income: 23.3 billion USD (+2%)
- *Consumer & Community Banking Revenue: 18.8 billion USD (+6%)
- *Commercial & Investment Bank Revenue: 19.5 billion USD (+9%)
- *Asset & Wealth Management Revenue: 5.8 billion USD (+10%)
- *Corporate Revenue: 1.5 billion USD (–85%)
- *Assets Under Management: 4.3 trillion USD (+18%)
- *Client Assets: 6.4 trillion USD (+19%)
Despite the decline in revenue and net income, JPMorgan Chase & Co.’s Q2 2025 financial results exceeded analysts’ expectations. The company reported net income of 15.0 billion USD and earnings per share of 5.24 USD, compared with expectations of around 4.96 USD, while revenue of 45.7 billion USD came in slightly above the consensus forecast. Two segments stood out in particular. Commercial & Investment Bank revenue increased 9%, while net income reached 6.7 billion USD, supported by a 15% surge in trading revenue and a 7% increase in investment banking fees. In addition, Asset & Wealth Management continued to grow strongly, with assets under management rising 18% to 4.3 trillion USD and fee revenue increasing at a double-digit rate, highlighting the diversification of revenue beyond net interest income.
One of the key positive signals was the increase in the full-year 2025 net interest income (NII) outlook. CFO Jeremy Barnum raised the guidance to 95.5 billion USD from 94.5 billion USD, citing sustained lending growth in mortgages, auto loans, and credit cards. The credit card net charge-off rate was also expected to be around 3.6%, indicating that risks remained under control and suggesting potential for net interest margin growth. The dividend increase to 1.50 USD in Q3 confirmed management’s confidence in the stability of cash flows.
JPMorgan Chase & Co. Q3 2025 financial results
On 14 October 2025, JPMorgan Chase & Co. published its Q3 2025 financial results. The key figures compared with the same period in 2024 are presented below:
- Revenue: 47.1 billion USD (+9%)
- Net Income: 14.4 billion USD (+12%)
- Earnings Per Share (EPS): 5.07 USD (+16%)
- Net Interest Income: 24.1 billion USD (+2%)
- Consumer & Community Banking Revenue: 19.5 billion USD (+9%)
- Commercial & Investment Bank Revenue: 19.9 billion USD (+17%)
- Asset & Wealth Management Revenue: 6.1 billion USD (+12%)
- Corporate Revenue: 1.7 billion USD (–45%)
- Assets Under Management: 4.6 trillion USD (+18%)
- Client Assets: 6.8 trillion USD (+20%)
JPMorgan’s Q3 2025 results exceeded market expectations. Net income reached 14.4 billion USD, while earnings per share came in at 5.07 USD, compared with expectations of around 4.85 USD. Revenue reached 47.1 billion USD, up 9% year-on-year. Trading and investment banking were the main contributors. Compared with the previous quarter, net income declined slightly by 4%, mainly due to higher expenses and increased provisions for potential credit losses.
The bank continued to actively return capital to shareholders, paying 4.1 billion USD in dividends and repurchasing 8 billion USD of shares during the quarter. Return on tangible common equity (ROTCE) was 20%, indicating strong business efficiency.
Management raised its 2025 net interest income outlook to 95.8 billion USD. For Q4, the bank expected around 25 billion USD in net interest income and approximately 24.5 billion USD in expenses. The outlook for credit card charge-offs was also slightly improved.
The main Q3 challenges stemmed from higher credit costs, which reached 3.4 billion USD, including charge-offs and additional provisions. Part of these costs reflected losses following the bankruptcy of auto lender Tricolor, amounting to around 170 million USD.
JPMorgan Chase & Co. Q4 2025 financial results
On 13 January 2026, JPMorgan Chase & Co. published its Q4 2025 financial results. The key figures compared with the same period in 2024 are presented below:
- Revenue: 46.8 billion USD (+7%)
- Net Income: 13.0 billion USD (–7%)
- Earnings Per Share (EPS): 4.63 USD (–4%)
- Net Interest Income: 25.1 billion USD (+7%)
- Consumer & Community Banking Revenue: 19.4 billion USD (+6%)
- Commercial & Investment Bank Revenue: 19.4 billion USD (+10%)
- Asset & Wealth Management Revenue: 6.5 billion USD (+13%)
- Corporate Revenue: 1.5 billion USD (–26%)
- Assets Under Management: 4.8 trillion USD (+18%)
- Client Assets: 7.1 trillion USD (+20%)
JPMorgan Chase reported strong revenue for Q4 2025, although a one-off provision related to the Apple Card transaction weighed on overall earnings. Net income came in at 13.0 billion USD, earnings per share at 4.63 USD, and reported revenue at 45.8 billion USD. On a managed basis, revenue was 46.8 billion USD, up 7% year-on-year.
Excluding the one-off factor, the results were considerably stronger. The bank recorded a 2.2 billion USD provision related to the planned acquisition of the Apple Card portfolio, reducing EPS by 0.60 USD. Without this provision, earnings per share would have been 5.23 USD, above market expectations, while revenue was in line with the consensus forecast.
Credit metrics appeared weaker, although this was largely due to the one-off factor. Credit costs totalled 4.7 billion USD, and net charge-offs totalled 2.5 billion USD, with the 2.2 billion USD Apple Card provision accounting for the largest share of the increase. The existing credit card portfolio remained stable, with a net charge-off rate of 3.14%.
The bank continued returning capital to shareholders. During the quarter, it paid 4.1 billion USD in dividends, or 1.50 USD per share, and repurchased 7.9 billion USD of shares.
The 2026 outlook pointed to steady revenue growth alongside higher expenses. JPMorgan expected around 103 billion USD in net interest income, expenses of 105 billion USD, and a credit card net charge-off rate of around 3.4%. This suggested that income would remain strong, albeit with higher costs already factored into the outlook.
JPMorgan Chase & Co. Q1 2026 financial results
On 14 April 2026, JPMorgan Chase & Co. published its Q1 2026 financial results. The key figures compared with the same period in 2025 are presented below:
- Revenue: 50.5 billion USD (+10%)
- Net Income: 16.5 billion USD (+13%)
- Earnings Per Share (EPS): 5.94 USD (+17%)
- Net Interest Income: 25.5 billion USD (+7%)
- Consumer & Community Banking Revenue: 19.6 billion USD (+7%)
- Commercial & Investment Bank Revenue: 23.4 billion USD (+19%)
- Asset & Wealth Management Revenue: 6.4 billion USD (+11%)
- Corporate Revenue: 1.2 billion USD (–47%)
- Assets Under Management: 4.8 trillion USD (+16%)
- Client Assets: 7.1 trillion USD (+18%)
JPMorgan Chase & Co. reported strong Q1 2026 results, with cleaner figures than in the previous quarter. Unlike Q4 2025, when earnings were weighed down by a 2.2 billion USD provision related to the Apple Card portfolio transaction, there was no comparable one-off impact this time. Net income came in at 16.5 billion USD, earnings per share at 5.94 USD, and revenue reached 50.5 billion USD, up 10% from the same period a year earlier. The results exceeded market expectations, with analysts having forecast earnings per share of 5.45 USD and revenue of 49.2 billion USD.
Credit performance remained resilient. Total credit costs amounted to 2.5 billion USD, compared with 3.3 billion USD a year earlier. Net charge-offs were virtually unchanged at 2.3 billion USD, while the net addition to credit reserves declined to 191 million USD from 973 million USD a year earlier. The Card Services net charge-off rate was around 3.46–3.47%.
The bank continued to actively return capital to shareholders. During the quarter, it paid 4.1 billion USD in dividends, or 1.50 USD per share, and repurchased 8.1 billion USD of shares.
The 2026 outlook remained strong, although more measured. The bank expected net interest income of around 103 billion USD and around 95 billion USD excluding Markets. The bank forecast a credit card net charge-off rate of 3.4%, while adjusted expenses were expected to be around 105 billion USD. This indicated that management expected income to remain high while factoring in higher costs and maintaining a cautious approach given the bank’s exposure to market conditions and interest rates.
JPMorgan Chase & Co. Q2 2026 financial results
On 14 July 2026, JPMorgan Chase & Co. published its Q2 2026 financial results for the quarter ended 30 June. The key figures compared with the same period in 2025 are presented below:
- Revenue: 58.0 billion USD (+27%)
- Net Income: 21.2 billion USD (+41%)
- Earnings Per Share (EPS): 7.70 USD (+47%)
- Net Interest Income: 25.6 billion USD (+10%)
- Consumer & Community Banking Revenue: 20.3 billion USD (+8%)
- Commercial & Investment Bank Revenue: 24.9 billion USD (+27%)
- Asset & Wealth Management Revenue: 6.9 billion USD (+19%)
- Corporate Revenue: 6.0 billion USD (+293%)
- Assets Under Management: 5.1 trillion USD (+18%)
- Client Assets: 7.7 trillion USD (+18%)
JPMorgan Chase & Co. delivered even stronger Q2 2026 results than in the previous quarter. However, part of the growth was driven by one-off factors. In Q2, the bank recorded 4.6 billion USD in net income related to Visa share transactions, as well as around 1.0 billion USD in gains on certain equity investments. Excluding these significant items, net income was 16.9 billion USD, and EPS was 6.14 USD.
Credit quality remained stable. Credit costs amounted to 2.5 billion USD, unchanged from Q1, while the credit card net charge-off rate declined to 3.34% from 3.46% in the previous quarter.
The bank continued to actively return capital to shareholders. During the quarter, it paid 4.0 billion USD in dividends, or 1.50 USD per share, and repurchased 6.2 billion USD of shares. The CET1 ratio remained high at 14.1%, while book value per share increased to 133.01 USD.
The 2026 outlook became slightly stronger for net interest income but more cautious on expenses. JPMorgan raised its net interest income outlook excluding Markets to 105.5 billion USD and increased its expense guidance to 107.5 billion USD. This indicated that the bank expected business activity to remain strong, although rising costs would continue to constrain efficiency.
JPMorgan Chase & Co. Q3 2026 financial results
On 13 October 2026, JPMorgan Chase & Co. published its Q3 2026 financial results for the quarter ended 30 September. The key figures compared with the same period in 2025 are as follows:
- Revenue: 50.9 billion USD (+8%)
- Net Income: 15.3 billion USD (+6%)
- Earnings Per Share (EPS): 5.57 USD (+10%)
- Net Interest Income: 27.1 billion USD (+13%)
- Consumer & Community Banking Revenue: 21.2 billion USD (+9%)
- Commercial & Investment Bank Revenue: 22.7 billion USD (+14%)
- Asset & Wealth Management Revenue: 6.9 billion USD (+14%)
- Corporate Revenue: 0.093 billion USD (–95%)
- Assets Under Management: 5.2 trillion USD (+13%)
- Client Assets: 7.9 trillion USD (+15%)
JPMorgan ended Q3 2026 with rising revenue and a resilient credit portfolio, although translating business growth into additional profit became more challenging. Revenue on a managed basis increased 8% to 50.9 billion USD, while net income rose 6% to 15.3 billion USD. Earnings per share came in at 5.57 USD. These results show that the bank continues to expand its business, but revenue is now growing faster than profit.
Higher net interest income provided the main support to the bank’s results. The bank earns money from the difference between the interest it receives on loans and other assets and the interest it pays to depositors and creditors. Net interest income increased 13% to 27.1 billion USD. Excluding Markets, growth was more moderate at 6%, bringing net interest income to 24.7 billion USD. Average loans increased 10%, while deposits rose 8%.
The consumer business continued to demonstrate the strength of JPMorgan’s customer base. Consumer & Community Banking revenue increased 9% to 21.2 billion USD, while net income rose 13% to 5.7 billion USD. Debit and credit card purchase volumes increased 10%. The bank also added more than 650,000 net new checking accounts. This expands its opportunities to generate revenue from everyday banking services, lending, and investment services.
The corporate and investment banking business delivered mixed results. Equities trading revenue increased 49%, while fixed income trading revenue declined 4%. Investment banking fees rose 14% year-on-year but fell 8% compared with Q2. This indicates that client activity remained high, although momentum slowed following a strong first half of the year.
Asset and wealth management provided additional resilience. Revenue in the segment increased 14% to 6.9 billion USD, while assets under management reached 5.2 trillion USD. Growth was supported by net client inflows and higher valuations of client investments. The bank earns fees for managing these assets, so growth in client assets provides a foundation for future revenue. However, exposure to stock market performance remains: a decline in portfolio values could reduce fee revenue even without client outflows.
The report’s main weakness was that expenses grew faster than revenue. They rose 12% to 27.3 billion USD. For every 100 USD of revenue, the bank now spends around 54 USD on operating the business, compared with 52 USD a year earlier. Profit before credit losses increased by only around 3%. As a result, business expansion is currently being accompanied by a notable increase in costs.
The most encouraging part of the report was the net interest income outlook. Management’s guidance implied around 106.2 billion USD for full-year 2026, including Markets. The preliminary 2027 outlook indicated around 107 billion USD excluding Markets, approximately 10% above the comparable 2026 guidance.
Overall, the report continues to support a positive assessment of JPMorgan’s business: the customer base is expanding, interest and fee income are growing, and credit losses remain manageable. Further share price growth will depend primarily on the bank delivering on its 2027 outlook and its ability to contain expenses. If additional revenue translates more meaningfully into profit, the bank’s investment appeal will strengthen.
Fundamental analysis of JPM and key drivers of JPMorgan Chase
In 2026, JPMorgan’s investment case depends on growth in net interest income, credit quality, and the bank’s ability to control expenses. The bank continues to expand its customer base and lending, but business growth delivers greater shareholder value when paired with improved profitability. Four key indicators can be used to assess the outlook for JPM shares:
- Net Interest Income excluding Markets
- Return on Tangible Common Equity – ROTCE
- Card Services Net Charge-Off Rate
- Managed Overhead Ratio
Net Interest Income excluding Markets shows how much the bank earns from interest-earning assets after deducting the cost of funding, excluding Markets. In Q3 2026, the figure increased 6% to 24.7 billion USD. Further growth while maintaining credit quality would support earnings and JPM shares.
Return on Tangible Common Equity – ROTCE shows how efficiently the bank uses shareholders’ capital. In Q3 2026, the figure stood at an annualised 20%. Consistently high levels support the attractiveness of the shares. Increases related to one-off income from Visa should be assessed separately.
Card Services Net Charge-Off Rate reflects credit card losses after recoveries. In 2026, the annualised rate declined from 3.47% in Q1 to 2.91% in Q3. Lower charge-offs support earnings, while an increase would signal growing financial pressure on borrowers.
Managed Overhead Ratio shows the proportion of revenue consumed by operating expenses. In Q3 2026, the ratio was 54%, compared with 52% a year earlier. A lower ratio indicates improved operating efficiency. A further increase would constrain profit growth even if revenue continues to rise.
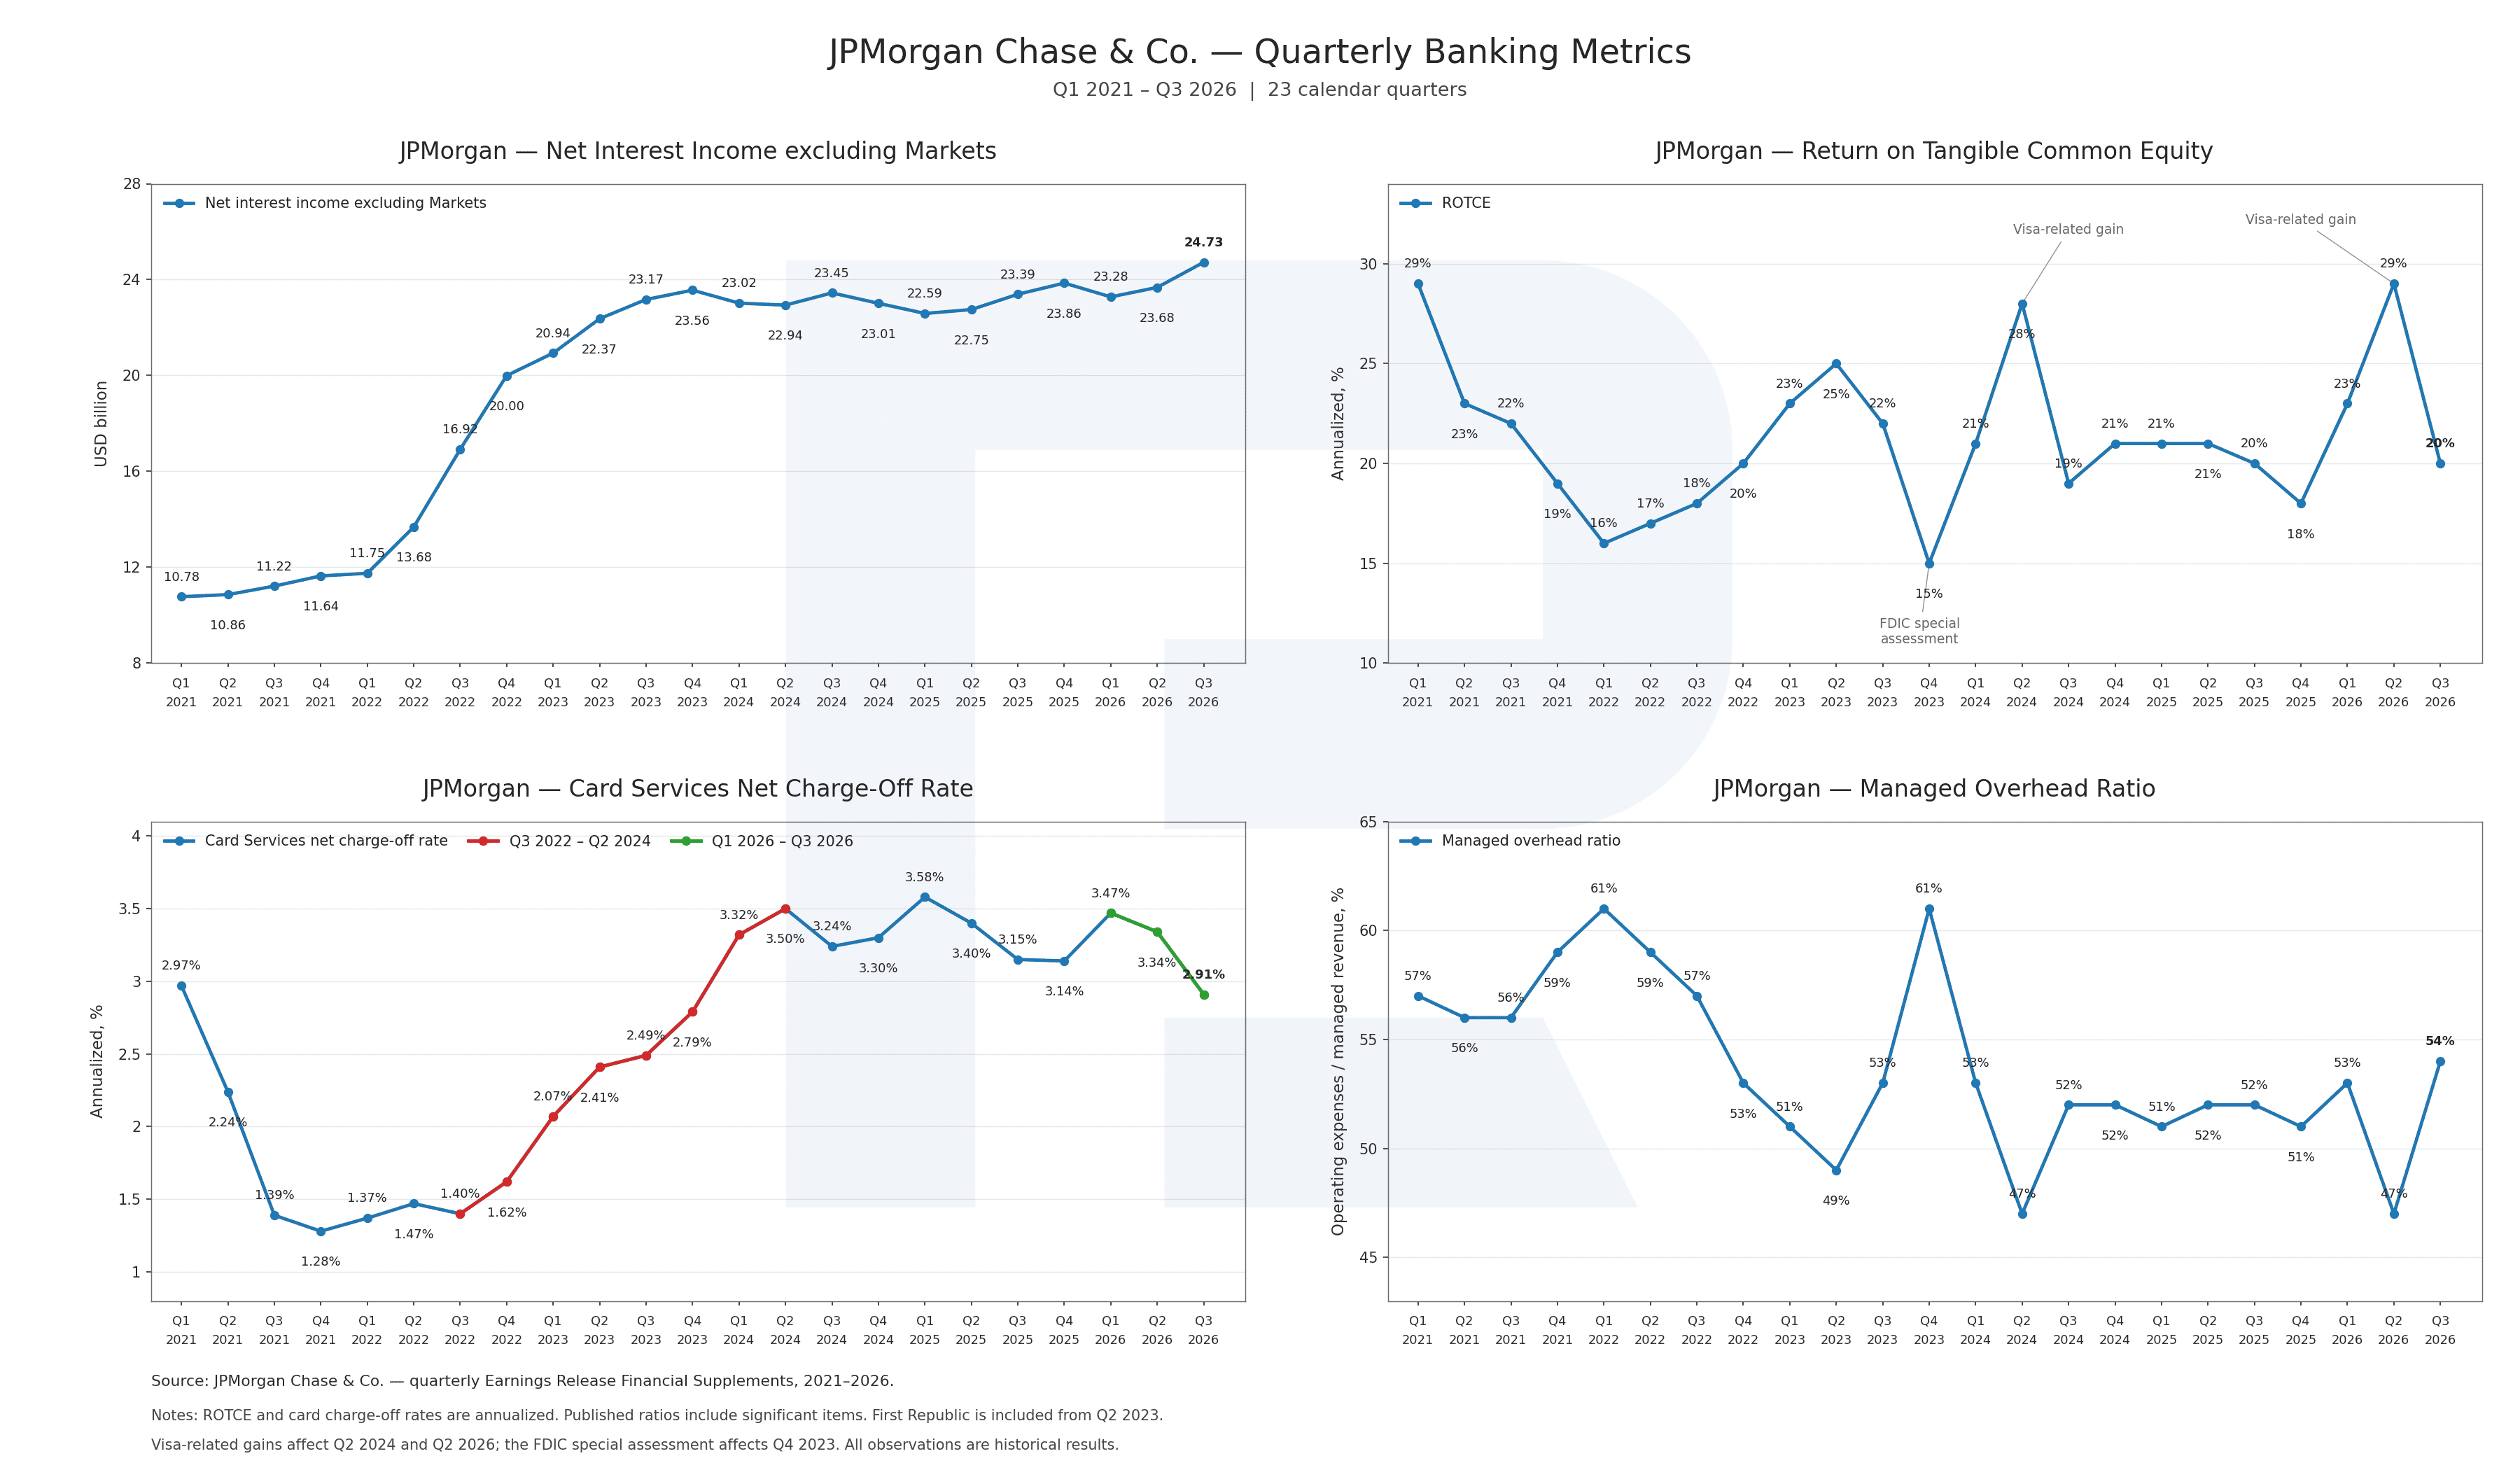
Fundamental analysis of JPM shows that the bank’s core business remains resilient. Following relatively stable results in 2024–2025, net interest income reached a new high of 24.73 billion USD in Q3 2026. At the same time, the credit card net charge-off rate declined to 2.91%, supporting the bank’s earnings. Return on tangible common equity remained high at an annualised 20%.
Expenses remain the main constraint. Their share of revenue increased to 54% from 52% a year earlier, meaning that revenue growth has yet to translate into a comparable improvement in efficiency. At the same time, ROTCE declined from its Q2 2026 peak, partly due to the absence of significant one-off income from Visa. These trends support a positive assessment of JPMorgan’s business, while further share price growth will depend on the bank’s ability to increase earnings and control costs.
Management’s guidance points to continued growth in net interest income. In Q4 2026, adjusted operating expenses excluding legal costs are forecast at 27.5 billion USD. The credit card net charge-off rate for full-year 2026 is expected to be 3.2%.
For 2027, JPMorgan provided a preliminary base case of around 107 billion USD in net interest income excluding Markets, approximately 10% above the comparable 2026 guidance. This provides a basis for further earnings growth, provided that increases in expenses and credit losses remain under control.
Analyst forecasts for JPMorgan Chase & Co. shares in 2026
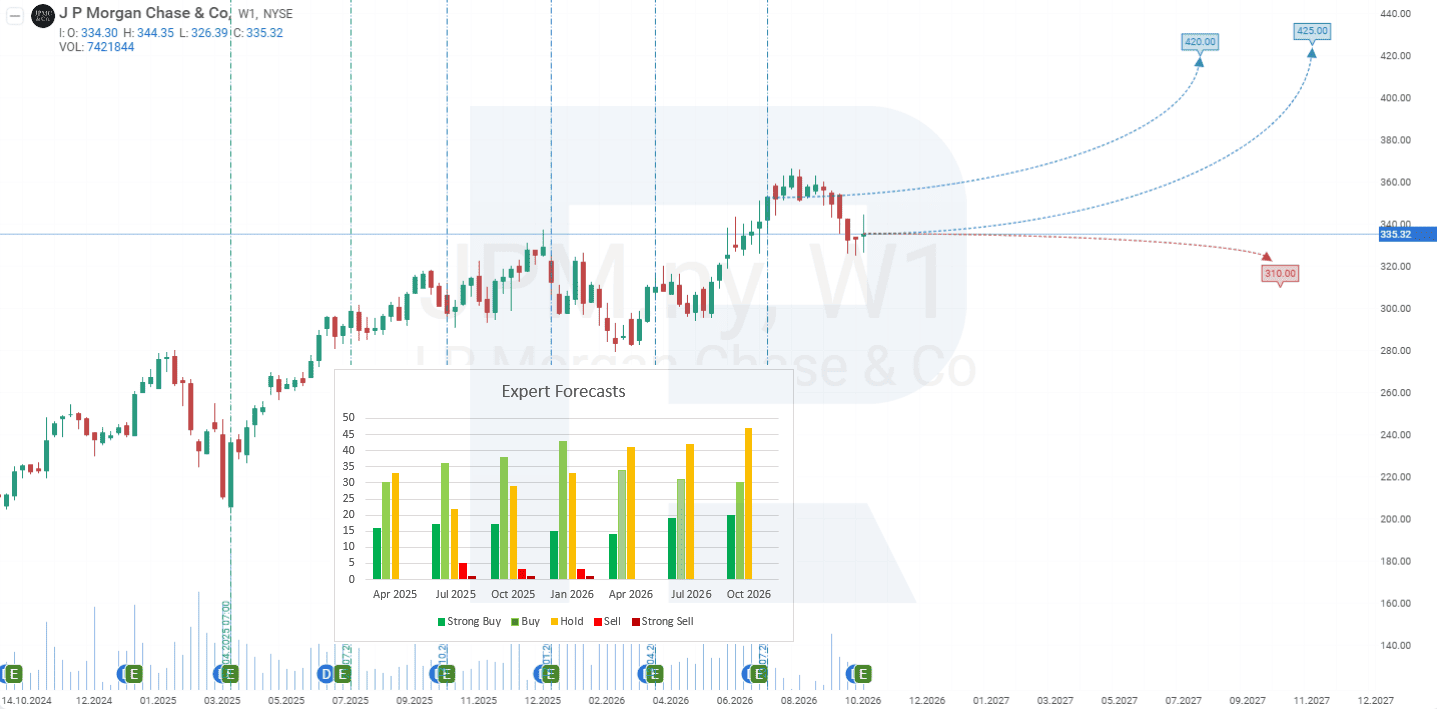
The analyst forecasts below are based on a 12-month horizon. The upper and lower bounds shown represent JPM share price targets over this period.
#. Barchart : 11 of 26 analysts rated JPMorgan Chase & Co. shares a Strong Buy, 2 a Moderate Buy, and 13 a Hold. The highest price target is 425 USD, and the lowest is 310 USD.
#. MarketBeat : 14 of 27 analysts rated the shares a Buy, while 13 gave them a Hold rating. The highest price target is 425 USD, and the lowest is 310 USD.
#. TipRanks : 10 of 19 analysts rated the shares a Buy and 9 a Hold. The highest price target is 425 USD, and the lowest is 312 USD.
#. Stock Analysis : 9 of 25 analysts rated the shares a Strong Buy, 4 a Buy, and 12 a Hold. The highest price target is 425 USD, and the lowest is 312 USD.
JPMorgan Chase & Co. stock price forecast for 2026
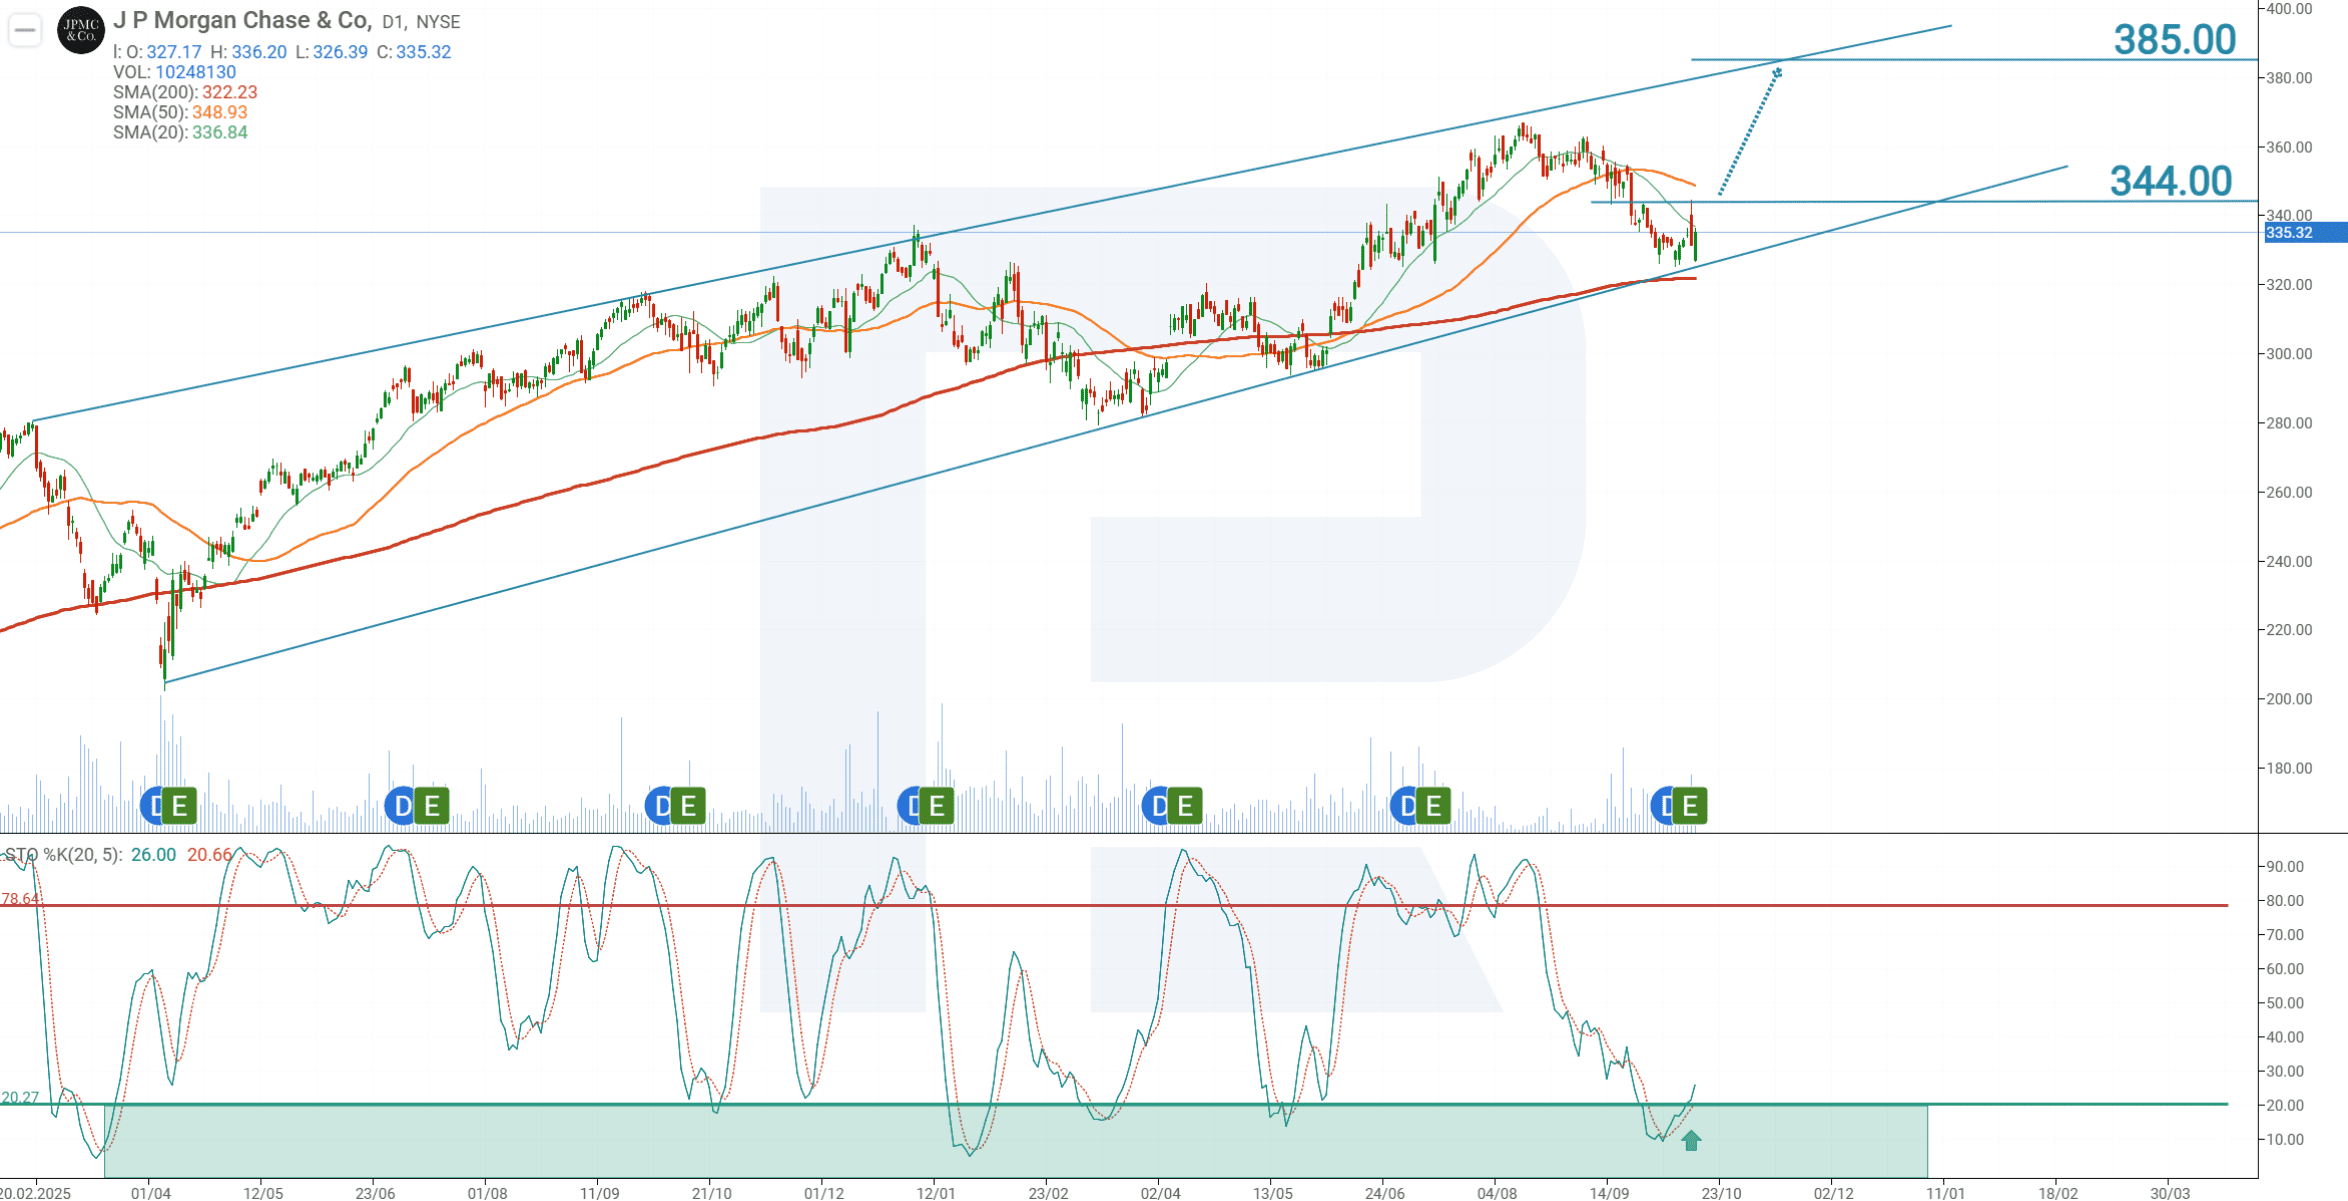
At the time of writing, JPM shares are trading at 335 USD.
On the daily chart, JPMorgan shares remain in an uptrend, with JPM trading above the 200-period moving average. The Stochastic oscillator has exited oversold territory, suggesting the corrective decline may be ending, and another upward wave could begin within the prevailing uptrend.
Based on the JPM technical analysis, the trading idea is to place a pending Buy Stop order at 346 USD. The order will trigger on a break above resistance at 344 USD, providing an additional signal for further upside. Take Profit is set near the resistance line at 384 USD. Stop Loss should be placed at 329 USD.
Buy Stop – 346.00
Take Profit – 384.00
Stop Loss – 329.00
Position management rule. Once the price moves 70% of the total distance towards the forecast target, the Stop Loss is set at the entry level. The protective order is then adjusted as the price advances, maintaining a distance of 7%. This continues until the position is closed at either Take Profit or Stop Loss, whichever level is reached first.
Risks of investing in JPMorgan Chase & Co. stock
Investment risks for JPMorgan Chase’s shares include the following factors:
- Resurgence of inflation: if inflation begins to rise again, the Federal Reserve may be forced to delay interest rate cuts or, worse, raise rates further. This could lead to a wave of loan delinquencies, requiring higher provisions for credit losses and resulting in increased write-offs under this line of expense.
#. Rising deposit interest rates: if policy rates increase, the bank will also need to raise deposit rates to stay competitive or risk customer attrition. The resulting rise in interest payments on deposits would negatively impact the bank’s profitability.
- Decline in stock indices: as investment banking currently generates the strongest revenue growth, a fall in stock indices could adversely affect JPMorgan Chase’s investment operations. This could also impact the credit sector, as stocks are often used as collateral for loans.
- Trade War: The tariffs imposed by the Trump administration could negatively impact JPMorgan's revenue. Increases in tariffs typically lead to higher business costs, reduced consumer demand, and a slowdown in economic activity. This, in turn, lowers demand for banking services as companies become more cautious, reducing their activity in the capital markets and scaling back mergers and acquisitions, which diminishes JPMorgan’s fee income. Furthermore, if trade tensions persist, the bank’s global clients may scale back investment plans, freeze export flows, and reduce overall activity, which would negatively impact all areas of the bank’s operations – from hedging and foreign exchange to traditional lending.
Risks associated with inflation, interest rates, and trade wars pose significant threats to JPMorgan Chase’s earnings. These factors should be carefully considered when assessing the investment appeal of the bank’s shares.
Ang mga pagtataya na ipinakita sa seksyong ito ay nagpapakita lamang ng pribadong opinyon ng may-akda at hindi dapat ituring bilang gabay para sa pagtetrade. Walang pananagutan ang RoboForex para sa mga resulta ng pagtetrade batay sa mga rekomendasyon sa pagtetrade na inilarawan sa mga analytical review na ito.