
Nike stock has fallen more than 80% – is NKE set for a reversal?
Nike shares have lost more than 80% from their all-time high, but the business is showing the first signs of improved operating efficiency. Could NKE form a bottom around 30 USD and begin a recovery towards 47 USD?
Nike, Inc. (NYSE: NKE) ended Q1 of the 2027 financial year with declines across its key financial metrics. Revenue fell 4% to 11.21 billion USD, net income declined 2% to 0.71 billion USD, and earnings per share came in at 0.48 USD. Weakness also remained evident across key areas of the business: NIKE Direct declined 8%, digital sales fell 13%, and revenue in Greater China dropped 22%. On the positive side, gross margin recovered to 42.8%, while operating expenses declined.
The company’s outlook for the 2027 financial year remains weak. Nike is preparing for a further decline in revenue as it simultaneously reduces volumes of selected Nike Sportswear and Jordan Brand models and restructures its operations in China. Management expects pressure on results to persist in both the 2027 and 2028 financial years.
This article provides a Nike stock analysis following the release of the company’s Q1 2027 financial results, examining its key business indicators and the reasons behind the continued decline in sales. It also provides a fundamental analysis of NKE and a technical analysis of NKE. Based on these findings, the article presents a Nike stock forecast and assesses the conditions under which the current bearish scenario could give way to a recovery.
About Nike, Inc.
Nike, Inc. is a US-based company founded on 25 January 1964 by Phil Knight and Bill Bowerman under the name Blue Ribbon Sports before rebranding as Nike in 1971. The company designs, manufactures, markets, and sells athletic footwear, apparel, accessories, and equipment. Its primary business segment is athletic footwear, which generates most of its revenue. Nike produces goods for a variety of sports, including running, basketball, football, tennis, golf, and fitness.
The company was listed on the NYSE on 2 December 1980 under the ticker symbol NKE.
Nike, Inc.’s main revenue sources
Nike’s revenue is generated from various sources within its business operations, with a primary focus on key areas such as footwear, apparel, and equipment, as well as brand licensing and digital platforms. Nike’s main revenue streams are outlined below:
- Footwear sales: Nike’s largest revenue source is footwear, including athletic sneakers, casual shoes, and specialised models for running, basketball, and fitness. In Q3 fiscal 2025, footwear remained the dominant category; however, quarterly data show a revenue decline in this segment, highlighting challenges related to excess inventory and competitive pressures.
- Apparel sales: this category encompasses sports and casual apparel, including T-shirts, shorts, tank tops, and outerwear. Apparel complements Nike’s footwear range and is a significant revenue stream, often related to seasonal demand and collaborations with sports companies.
- Sports equipment sales: Nike generates revenue from sports equipment, including bags, socks, gloves, and accessories. While smaller than the footwear and apparel segments, this category plays a supporting role in the brand’s ecosystem.
- Nike Direct: revenue from direct-to-consumer sales – including Nike’s website, mobile app, and physical stores –
falls under the Nike Direct segment. This channel prioritises direct sales to consumers and bypasses wholesalers. Digital sales remain a key focus for Nike, with continued investment in e-commerce.
Nike, Inc. Q3 2025 financial results
On 20 March, Nike published its Q3 2025 financial results for the quarter ended 28 February. The key figures, compared with the same period of the previous financial year, are presented below:
- Revenue: 11.27 billion USD (–9%)
- Net profit: 0.79 billion USD (–32%)
- Earnings per share: 0.54 USD (–30%)
- Gross margin: 41.5% (–330 basis points)
Revenue by region:
- North America: 4.86 billion USD (–4%)
- Europe, Middle East & Africa: 2.81 billion USD (–10%)
- Greater China: 1.73 billion USD (–17%)
- Asia Pacific & Latin America: 1.47 billion USD (–11%)
Management attributed the 9% decline in revenue to double-digit sales declines in January and February following a successful holiday season in December. The decline was particularly pronounced in China, where sales fell 17%.
Nike’s management forecast a significant decline in revenue for Q4 2025, ending 31 May 2025, with sales expected to fall 13.0–15.0%, compared with analysts’ expectations for a decline of 11.4–12.2%. The outlook reflected efforts to clear excess inventory and refresh ageing product lines amid external pressures such as tariffs and economic uncertainty.
Nike’s management described Q3 as a period of progress amid challenging conditions. The company exceeded earnings expectations but continued to face pressure on revenue and margins. For the following quarter, management forecast a steeper decline in sales and further pressure on margins as part of the company’s strategic business reset, while expecting conditions to improve in the 2026 financial year.
Nike, Inc. Q4 2025 financial results
On 26 June, Nike published its Q4 2025 financial results for the quarter ended 31 May. The key figures, compared with the same period of the previous financial year, are presented below:
- Revenue: 11.10 billion USD (–12%)
- Net profit: 0.21 billion USD (–86%)
- Earnings per share: 0.14 USD (–86%)
- Gross margin: 40.3% (–440 basis points)
Revenue by region:
- North America: 4.70 billion USD (–11%)
- Europe, Middle East & Africa: 3.00 billion USD (–9%)
- Greater China: 1.48 billion USD (–21%)
- Asia Pacific & Latin America: 1.58 billion USD (–8%)
Q4 was one of Nike’s weakest quarters. Revenue fell 12%, while net profit declined 86%. The drop in sales remained particularly pronounced in China, where revenue fell 21%. Despite this, results beat market expectations.
Management described Q4 as the low point of the company’s current business reset. Nike continued reducing older inventory, cutting its reliance on discounting, and refreshing its product range, with a greater focus on key sports categories.
For Q1 2026, Nike forecast a mid-single-digit decline in revenue, a better outlook than previous market estimates. At the same time, the company expected gross margin to contract by 350–425 basis points due to tariff-related costs and changes in the sales mix.
The market responded with a 14% rise in Nike shares. Analysts at JPMorgan, HSBC, Jefferies, and other investment firms raised their price targets for the stock, pointing to signs that a sustainable turnaround in the company’s business was beginning.
Nike, Inc. Q1 2026 financial results
On 30 September, Nike published its Q1 2026 financial results for the quarter ended 31 August. The key figures, compared with the same period of the previous financial year, are presented below:
- Revenue: 11.72 billion USD (+1%)
- Net profit: 0.72 billion USD (–31%)
- Earnings per share: 0.49 USD (–30%)
- Gross margin: 42.2% (–320 basis points)
Revenue by region:
- North America: 5.02 billion USD (+4%)
- Europe, Middle East & Africa: 3.33 billion USD (+6%)
- Greater China: 1.51 billion USD (–9%)
- Asia Pacific & Latin America: 1.49 billion USD (+2%)
Nike’s results beat analysts’ expectations. Revenue rose 1% to 11.72 billion USD, supported by growth in wholesale sales and recovering demand in North America. Running, training, and basketball remained the strongest categories.
However, challenges persisted. NIKE Direct sales declined 4%, digital sales fell 12%, and revenue in China decreased 9%. Gross margin fell to 42.2% due to discounting, a shift in the sales mix, and higher costs, including tariffs.
For the following quarter, the company expected revenue to decline by a few per cent and gross margin to contract by a further 3.0–3.75 percentage points. Management also warned that direct sales through Nike’s own channels were unlikely to return to growth during the 2026 financial year.
Overall, Nike showed the first signs of a sales recovery, but profitability and direct sales channels remained weak. The key question for the following quarters was whether growth in wholesale sales could translate into a more sustainable recovery in the business.
Nike, Inc. Q2 2026 financial results
On 18 December, Nike published its Q2 2026 financial results for the quarter ended 30 November. The key figures, compared with the same period of the previous financial year, are presented below:
- Revenue: 12.43 billion USD (+1%)
- Net profit: 0.79 billion USD (–32%)
- Earnings per share: 0.53 USD (–32%)
- Gross margin: 40.6% (–300 basis points)
Revenue by region:
- North America: 5.63 billion USD (+9%)
- Europe, Middle East & Africa: 3.39 billion USD (–1%)
- Greater China: 1.42 billion USD (–17%)
- Asia Pacific & Latin America: 1.67 billion USD (–4%)
Nike’s revenue rose 1% and came in slightly above market expectations, but profitability continued to deteriorate. Gross margin fell to 40.6%, while net profit declined by nearly a third.
Growth was driven primarily by the wholesale channel, where sales increased 8%. Meanwhile, NIKE Direct declined 8%, and digital sales fell 14%, indicating continued weakness in the more profitable direct channels.
Additional pressure came from China, tariffs, and clearing older inventory. Revenue in Greater China fell 17%, while management estimated the additional cost of new tariffs at around 1.5 billion USD per year.
For Q3 2026, Nike expected revenue to decline by a low-single-digit percentage, with margins remaining under pressure. Overall, the company’s sales remained relatively resilient, but a recovery in profitability had yet to begin.
Nike, Inc. Q3 2026 financial results
On 31 March, Nike published its Q3 2026 financial results for the quarter ended 28 February. The key figures, compared with the same period of the previous financial year, are presented below:
- Revenue: 11.28 billion USD (+0%)
- Net profit: 0.52 billion USD (–35%)
- Earnings per share: 0.35 USD (–35%)
- Gross margin: 40.2% (–130 basis points)
Revenue by region:
- North America: 5.03 billion USD (+3%)
- Europe, Middle East & Africa: 2.87 billion USD (+2%)
- Greater China: 1.62 billion USD (–7%)
- Asia Pacific & Latin America: 1.49 billion USD (+1%)
Nike’s revenue was virtually unchanged, but profitability continued to decline. Net profit fell 35%, while gross margin decreased to 40.2%, primarily due to higher tariff costs in North America.
Growth was again driven by the wholesale channel, where sales increased 5%. At the same time, NIKE Direct declined 4%, digital sales fell 9%, and sales at Nike-owned stores decreased 5%.
For Q4 2026, Nike expected revenue to decline 2–4%. Sales in Greater China could fall by around 20%, while gross margin could decline by a further 25–75 basis points.
Overall, Nike’s revenue had stabilised, but profitability and direct sales remained under pressure. For a sustainable recovery, the company still needs to improve margins, restore growth in NIKE Direct, and stabilise its business in China.
Nike, Inc. Q4 2026 financial results
On 30 June, Nike published its Q4 2026 financial results for the quarter ended 31 May. The key figures, compared with the same period of the previous financial year, are presented below:
- Revenue: 10.97 billion USD (–1%)
- Net profit: 1.07 billion USD (+407%)
- Earnings per share: 0.72 USD (+414%)
- Gross margin: 49.2% (+890 basis points)
Revenue by region:
- North America: 4.83 billion USD (+3%)
- Europe, Middle East & Africa: 2.98 billion USD (–1%)
- Greater China: 1.30 billion USD (–12%)
- Asia Pacific & Latin America: 1.60 billion USD (+1%)
Nike’s revenue declined 1%, while profit and gross margin rose sharply, driven primarily by an expected 986 million USD refund of import tariffs. This one-off factor added around 900 basis points to gross margin and 0.52 USD to earnings per share.
The underlying challenges in the business persisted. NIKE Direct declined 7%, digital sales fell 12%, and sales at Nike-owned stores decreased 7%. Meanwhile, wholesale sales increased 4%, while revenue in Greater China fell 12%.
For Q1 2027, Nike expected revenue to decline by a low- to mid-single-digit percentage, followed by a further slowdown in Q2. At the same time, management noted early signs of margin stabilisation.
Overall, Q4 did not yet confirm a sustainable recovery for Nike. The strong profit increase was driven by a one-off tariff refund, while direct sales and revenue in China continued to decline.
Nike, Inc. Q1 2027 financial results
On 1 October, Nike published its Q1 2027 financial results for the quarter ended 31 August. The key figures, compared with the same period of the previous financial year, are presented below:
- Revenue: 11.21 billion USD (–4%)
- Net profit: 0.71 billion USD (–2%)
- Earnings per share: 0.48 USD (–2%)
- Gross margin: 42.8% (+60 basis points)
Revenue by region:
- North America: 5.13 billion USD (+2%)
- Europe, Middle East & Africa: 3.18 billion USD (–5%)
- Greater China: 1.18 billion USD (–22%)
- Asia Pacific & Latin America: 1.46 billion USD (–2%)
Q1 2027 showed that Nike’s recovery remained uneven. Revenue fell 4% to 11.21 billion USD and came in slightly below market expectations, while earnings per share of 0.48 USD exceeded analysts’ forecasts. Gross margin recovered, rising 60 basis points to 42.8% on lower warehousing and logistics costs. Meanwhile, net profit declined by just 2%, significantly less than revenue.
However, sales remained weak. NIKE Direct declined 8%, digital sales fell 13%, and sales at Nike-owned stores decreased 5%. Even the wholesale channel, which had previously supported the company’s results, declined 1%. This suggests Nike’s challenges extend beyond individual sales channels and are now affecting parts of its product range.
At the same time, a clear divergence emerged within the product portfolio. Categories directly related to sport grew at high-single-digit rates, while Running, Global Football, Tennis, and Golf delivered double-digit growth. Meanwhile, Nike Sportswear declined at a double-digit rate, while Jordan Brand sales fell by around 15%. The company is deliberately reducing volumes of selected Jordan Retro models and other classic products to reduce discounting and restore a sense of scarcity around the brand.
China was once again the quarter’s main challenge. Reported revenue in Greater China fell 22% to 1.18 billion USD, while the decline reached 26% on a currency-neutral basis. Nike is reducing the number of digital partners and plans to concentrate online sales through its own channels and official stores on Tmall, JD, and Douyin. The aim is to reduce discounting and restore the brand’s premium positioning, although management warned that restructuring the China business would take several seasons.
At the same time, Nike announced a new business restructuring program called Pace. The company plans to simplify its management structure, cut additional jobs, consolidate operations into three major regions, and modernise its supply chain. The program is expected to deliver around 2.5 billion USD in cumulative savings through the 2031 financial year, although its implementation will require around 1.0 billion USD in costs.
The main negative development was the outlook. For the full 2027 financial year, Nike expects revenue to decline by a high single-digit percentage, while the market expected a much more moderate decline. Adjusted earnings per share are expected to range from 1.15 USD to 1.35 USD. Moreover, management warned that reduced supply of Nike Sportswear and Jordan Brand products, along with the restructuring of the business in China, would weigh on sales throughout the 2027 financial year and partly into the 2028 financial year.
Overall, Q1 2027 cannot yet be described as the beginning of a full recovery for Nike. The improvement in gross margin, growth in sports categories, and resilience in North America are positive signs. Still, they are not yet sufficient to offset the decline in NIKE Direct, weakness in Sportswear and Jordan Brand, and the sharp drop in sales in China. The company is effectively choosing a more painful path: deliberately reducing sales and the supply of selected products now to clear distribution channels and restore brand value over the longer term.
Fundamental analysis of NKE and key drivers of Nike, Inc. stock
In the 2027 financial year, Nike’s investment case largely depends on whether the company can restore demand for its products while improving operating efficiency under the Pace program. To assess whether the situation is genuinely beginning to improve, four key indicators are worth monitoring:
- NIKE Direct Revenue Growth
- Greater China Revenue Growth
- Gross Margin
- Operating Overhead Expense
NIKE Direct Revenue Growth tracks sales through Nike’s own stores and digital channels. This indicator is particularly important because direct sales give the company greater control over pricing, product assortment, and customer relationships. If the decline in NIKE Direct begins to slow and sales return to growth, this would be one of the clearest signs of a recovery in demand for Nike products.
Greater China Revenue Growth provides insight into the situation in one of the company’s most challenging markets. Nike’s sales in China have declined significantly, so the first step would be a slowdown in the rate of decline, followed by stabilisation and only then a return to growth. An improvement in this indicator would provide important confirmation that changes to the product assortment, pricing strategy, and sales channels are beginning to deliver results.
Gross Margin shows how much of the company’s revenue remains after the direct costs of producing and selling its products. For Nike, the key is not continuous margin expansion, but rather a recovery and the ability to maintain gross margin at a normal level. An improvement could indicate lower logistics and production costs, reduced discounting, and a stronger product mix. However, the jump in Gross Margin to 49.2% in Q4 2026 should be considered separately: around 900 basis points of the increase were related to the expected refund of IEEPA tariffs.
Operating Overhead Expense provides insight into how effectively Nike is controlling its internal costs. These include personnel, administrative functions, technology, and other operating expenses. A decline in this indicator, alongside stabilising sales, could significantly accelerate profit recovery. In Q1 2027, Operating Overhead fell to 2.658 billion USD from 2.828 billion USD a year earlier, already reflecting the impact from cost reductions.
Overall, the most favourable scenario for Nike shares would be a combination of stabilising NIKE Direct and sales in China, recovering Gross Margin, and a further decline in Operating Overhead Expense. In this scenario, the company could halt the decline in revenue while improving operating efficiency. If sales begin to recover from an already lower cost base, Nike’s profit could grow faster than revenue, creating a stronger fundamental basis for an increase in NKE stock.
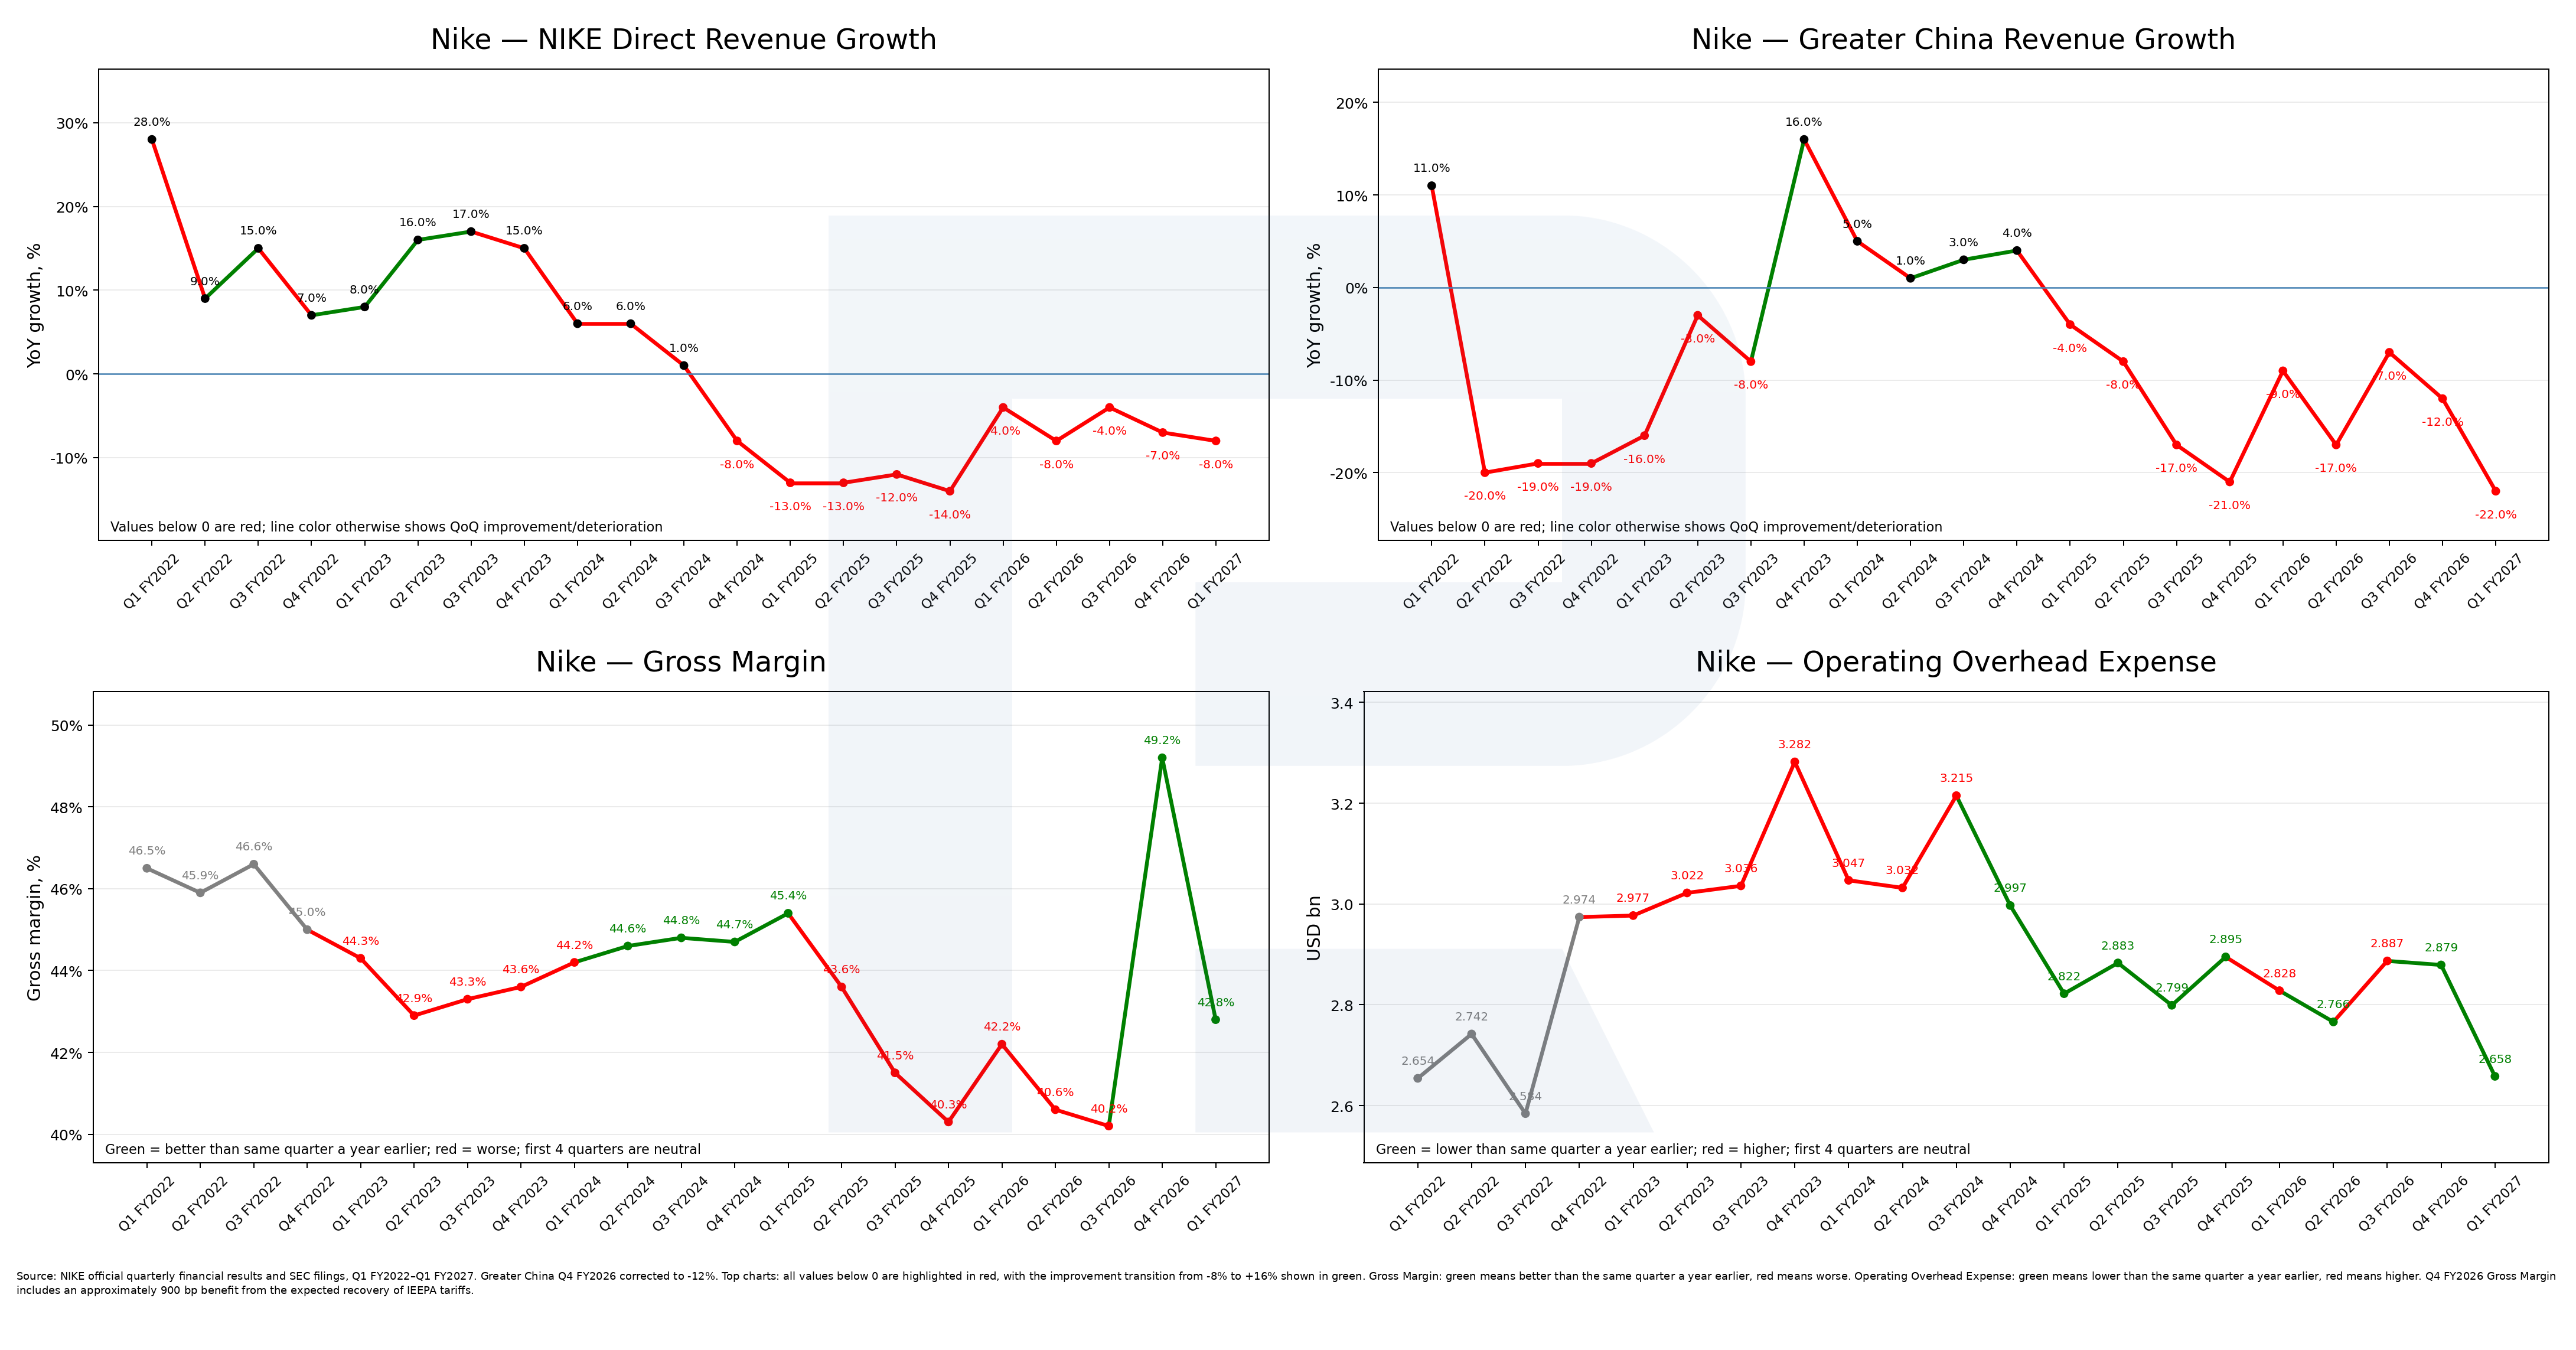
The charts show that Nike has not yet halted the contraction in its business. NIKE Direct Revenue Growth has remained negative since Q3 2024, meaning that sales through the company’s own channels have been declining for an extended period. Even when the pace of decline slows in individual quarters, sales are still falling relative to an already lower base from the previous year.
Greater China remains the most significant challenge. After a brief improvement in the 2024 financial year, sales resumed their decline, falling 22% year-on-year in Q1 2027. This suggests that demand recovery in China has yet to begin and that the region’s restructuring has not yet delivered a noticeable improvement.
At the same time, Nike’s underlying economics look considerably better than its sales performance. Gross Margin rose to 42.8% in Q1 2027 from 42.2% a year earlier, while Operating Overhead Expense declined from 2.828 billion USD to 2.658 billion USD. In other words, the company is already reducing costs and improving efficiency despite declining revenue. If this process continues, Nike could deliver significantly stronger profit growth once sales at least stabilise.
As a result, Nike’s fundamental picture remains weak in terms of demand but looks considerably better in terms of operating efficiency. The main risk remains the decline in NIKE Direct and the sharp drop in sales in China. However, margin recovery and lower operating expenses show the company is already adapting its cost structure to a weaker market.
Management has also warned that the 2027 financial year will be challenging. Nike expects revenue to decline by a high single-digit percentage and warned that reduced supply of Nike Sportswear and Jordan Brand products, along with restructuring in China, will weigh on results throughout the 2027 financial year and partly into the 2028 financial year.
For NKE stock, how actual results compare with the company’s already weak outlook will therefore be particularly important.
Nike’s fundamental analysis shows that revenue has yet to turn around, but the company is already laying the groundwork for a profit recovery. If the decline in NIKE Direct slows noticeably over the coming quarters, sales in China stabilise, Gross Margin remains around current levels, and Operating Overhead continues to decline, this could provide the first meaningful confirmation that the business is emerging from the downturn.
Expert forecasts for Nike, Inc. stock
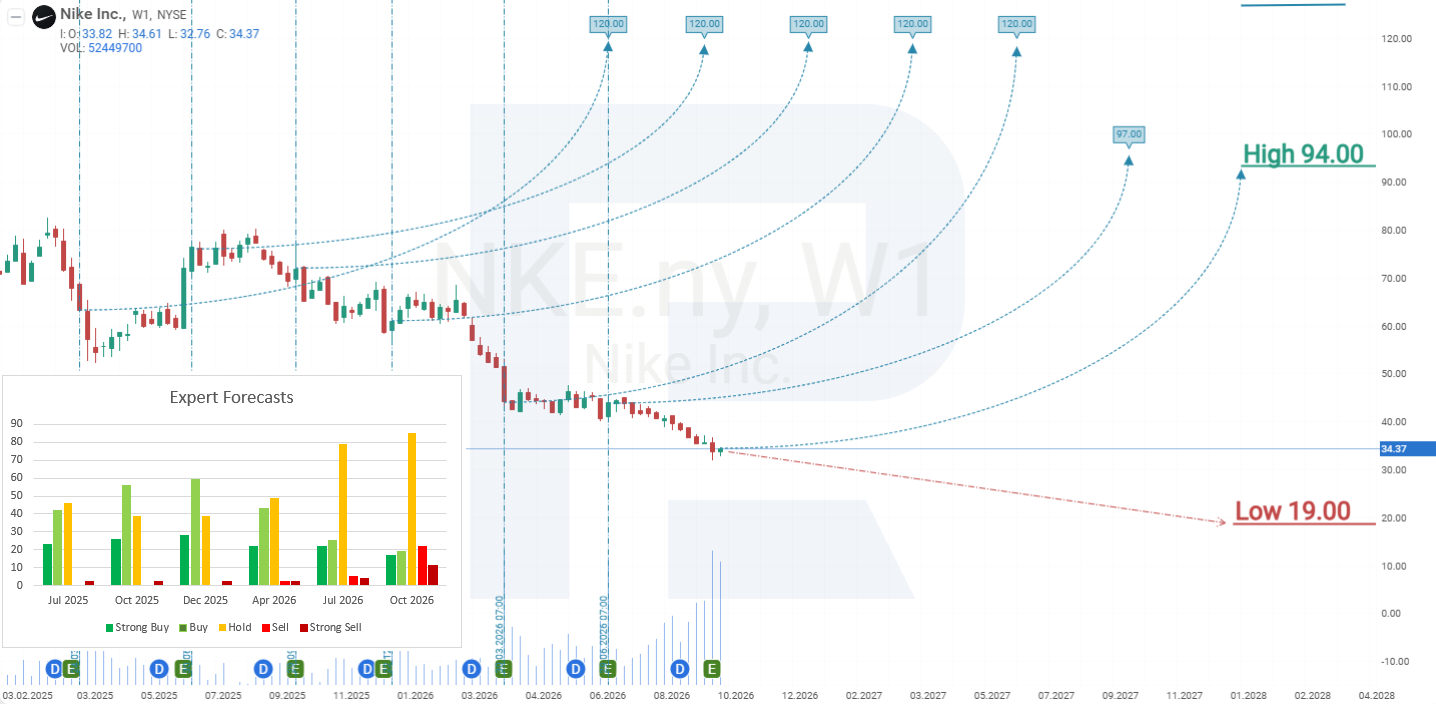
The analyst forecasts below are based on a 12-month horizon. The upper and lower ends of the ranges represent analysts’ target prices for Nike shares over this period.
- Barchart : of 39 analysts covering Nike stock, 8 rated it a Strong Buy, 2 a Moderate Buy, 21 a Hold, 1 a Sell, and 7 a Strong Sell. The highest price target is 71 USD, and the lowest is 19 USD.
- MarketBeat : of 39 analysts, 8 rated Nike shares a Buy, 21 a Hold, and 10 a Sell. The highest price target is 75 USD, and the lowest is 19 USD.
- TipRanks : of 34 analysts surveyed, 8 rated Nike shares a Buy, 18 a Hold, and 8 a Sell. The highest price target is 62 USD, and the lowest is 19 USD.
- Stock Analysis : of 42 analysts, 9 rated Nike shares a Strong Buy, 1 a Buy, 25 a Hold, 3 a Sell, and 4 a Strong Sell. The highest price target is 94 USD, and the lowest is 19 USD.
Nike, Inc. stock price forecast for 2026
At the time of writing, NKE shares are trading at 34 USD.
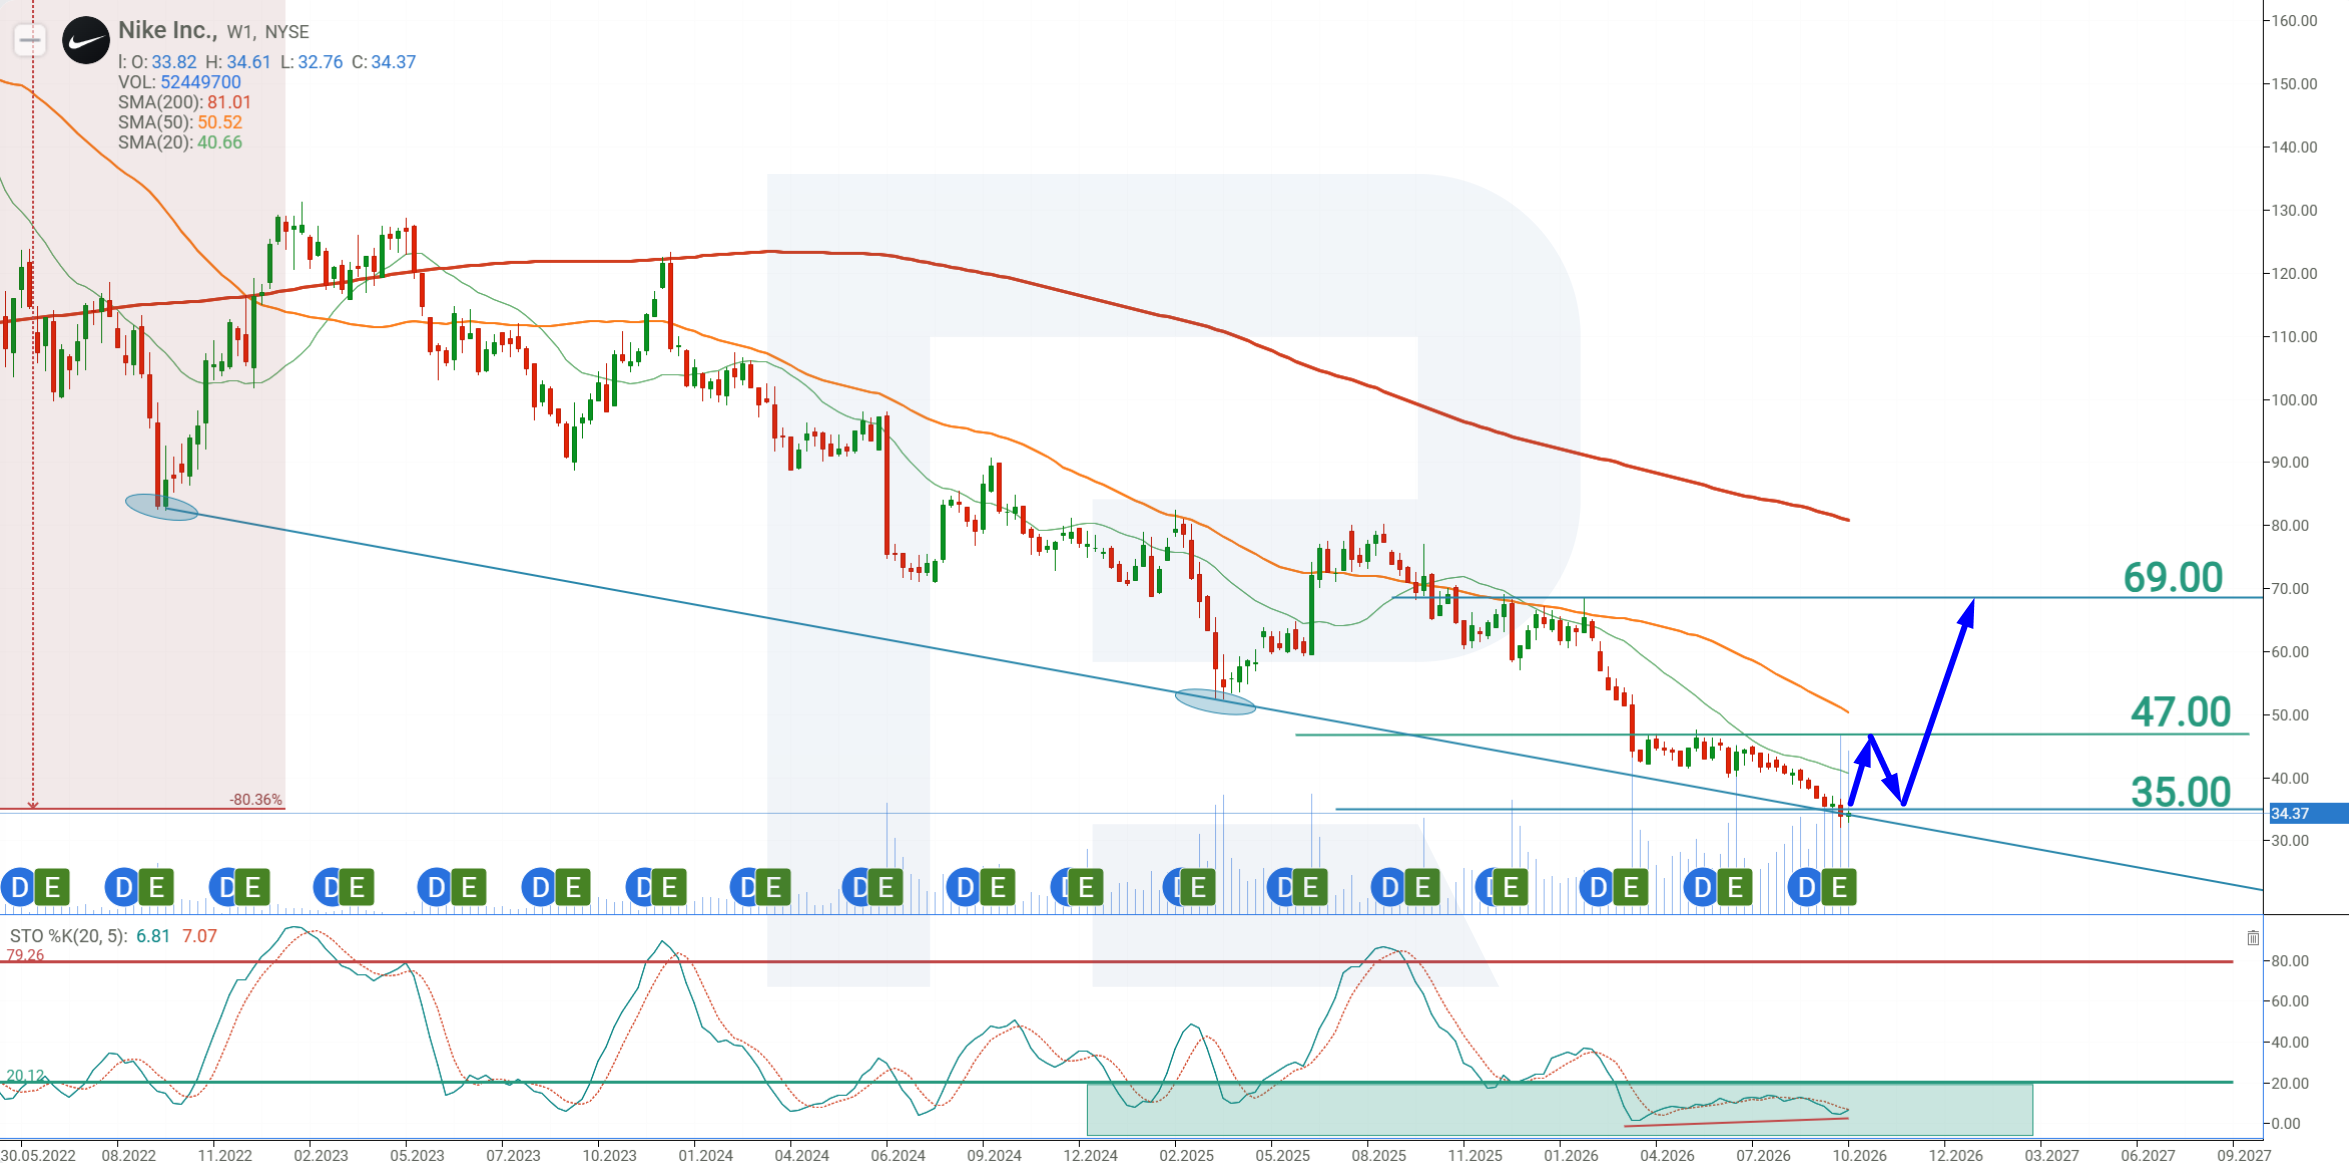
From their all-time high of 179 USD in November 2021, NKE shares have fallen more than 80%, reflecting the challenges facing the company. Given the reforms currently underway, betting on a further decline in the stock does not appear justified at this stage. However, there are still no significant signs of a sustainable recovery. The company’s outlook remains weak and is already largely priced into the stock. The key question is whether the next quarterly reports will confirm this outlook. Even if sales continue to decline, better-than-expected results could support NKE shares.
After the company released its Q1 2027 financial results, NKE shares fell sharply before the market opened but ended the session higher on increased volume. This suggests that investor interest in the company is beginning to strengthen around the 30 USD level.
Technical analysis of NKE shares shows that the price is trading at a support line, from which an upward rebound is possible. The Stochastic oscillator is deeply oversold, which is characteristic of a downtrend. At the same time, the oscillator shows a bullish convergence, also pointing to the possibility of a corrective rebound.
Based on the overall analysis of NKE shares, the stock does not currently appear ready for a strong upward move. However, the price is likely to enter a consolidation phase before the next quarterly report. That report could determine the stock’s next directional move.
The NKE trading idea is therefore based on a corrective rise towards resistance at 47 USD. To confirm this scenario, the stock needs to break above resistance at 35 USD. A Buy Stop order is therefore placed at 36 USD, with Take Profit at 47 USD and Stop Loss at 29 USD.
Buy Stop – 36.00
Take Profit – 47.00
Stop Loss – 29.00
Position management rule. Once the price moves 70% of the total distance towards the forecast target, the Stop Loss is set at the entry level. The protective order is then adjusted as the price advances, maintaining a distance of 10%. This process continues until the position is closed at either Take Profit or Stop Loss, depending on which level is reached first.
Risks of investing in Nike, Inc. stock
When investing in Nike, it is crucial to consider the risks that may negatively impact the company’s income and affect its investors. The main risks are outlined below:
- The impact of tariffs on profit margins: Nike has warned that higher tariffs on imports from China and Mexico could significantly reduce profit margins.
- Competition and loss of market share: Nike faces intense competition from brands such as New Balance and Adidas, which are strengthening their positions, particularly in casual footwear and retro model segments. This poses a threat to Nike’s market share.
- Economic instability: factors such as inflation, recession fears, and reduced purchasing power may reduce consumer spending on sportswear and footwear, ultimately impacting Nike’s revenues.
Ang mga pagtataya na ipinakita sa seksyong ito ay nagpapakita lamang ng pribadong opinyon ng may-akda at hindi dapat ituring bilang gabay para sa pagtetrade. Walang pananagutan ang RoboForex para sa mga resulta ng pagtetrade batay sa mga rekomendasyon sa pagtetrade na inilarawan sa mga analytical review na ito.