
XAUUSD risks accelerating its decline following a Triangle pattern breakout
XAUUSD is declining for the second consecutive day amid growing expectations of a Federal Reserve rate hike, with prices currently standing at 4,045 USD. Discover more in our analysis for 28 July 2026.
XAUUSD forecast: key takeaways
- Prices remain within a Triangle pattern after rebounding from its upper boundary
- Expectations of a change in Federal Reserve policy are putting pressure on gold
- Easing geopolitical tensions are limiting demand for safe-haven assets
- XAUUSD forecast for 28 July 2026: 3,825
Fundamental analysis
XAUUSD continues to move lower, declining for the second consecutive trading session. Prices remain trapped within a Triangle pattern, while selling pressure increased after a rebound from the upper boundary of the formation, with gold now heading towards its lower boundary. A breakout below the Triangle’s lower boundary at 3,965 USD could signal stronger downward momentum and open the way for a deeper decline.
Expectations regarding the Federal Reserve’s future policy are adding to pressure on the precious metal. Traders are factoring in the likelihood of an interest rate hike this week, which could strengthen Federal Reserve Chairman Kevin Warsh’s position in the fight against inflation following his statements on the need to restore price stability.
Gold also remains under pressure from easing geopolitical tensions. Following US President Donald Trump’s statement that Washington is in talks with Iran, concerns about energy supply disruptions eased, pushing oil prices lower and dampening demand for safe-haven assets.
Technical outlook
XAUUSD quotes have consolidated below the EMA-65, increasing selling pressure and the likelihood of a breakout below the lower boundary of the Triangle pattern. Today’s XAUUSD forecast suggests that the downward movement may resume, with a target at 3,825 USD.
Technical indicators confirm that bearish sentiment remains. The Stochastic Oscillator has turned downwards after rebounding from overbought territory, indicating weaker buying activity and a possible continuation of the downward momentum. An additional signal in favour of a further decline would be a breakout below the lower boundary of the Triangle pattern, followed by consolidation below 3,965 USD. This would confirm the strength of the bearish scenario, which could accelerate the XAUUSD decline towards the next support levels.
An alternative scenario would come into play if prices break confidently above the pattern’s upper boundary and consolidate above 4,135 USD. Such a signal would indicate that buyers have regained control, invalidate the current bearish outlook, and create conditions for the upward movement to resume, with the prospect of further growth.
XAUUSD overview
- Asset: XAUUSD
- Timeframe: H1 (intraday)
- Trend: downward
- Key resistance levels: 4,135 and 4,325
- Key support levels: 4,005 and 3,965
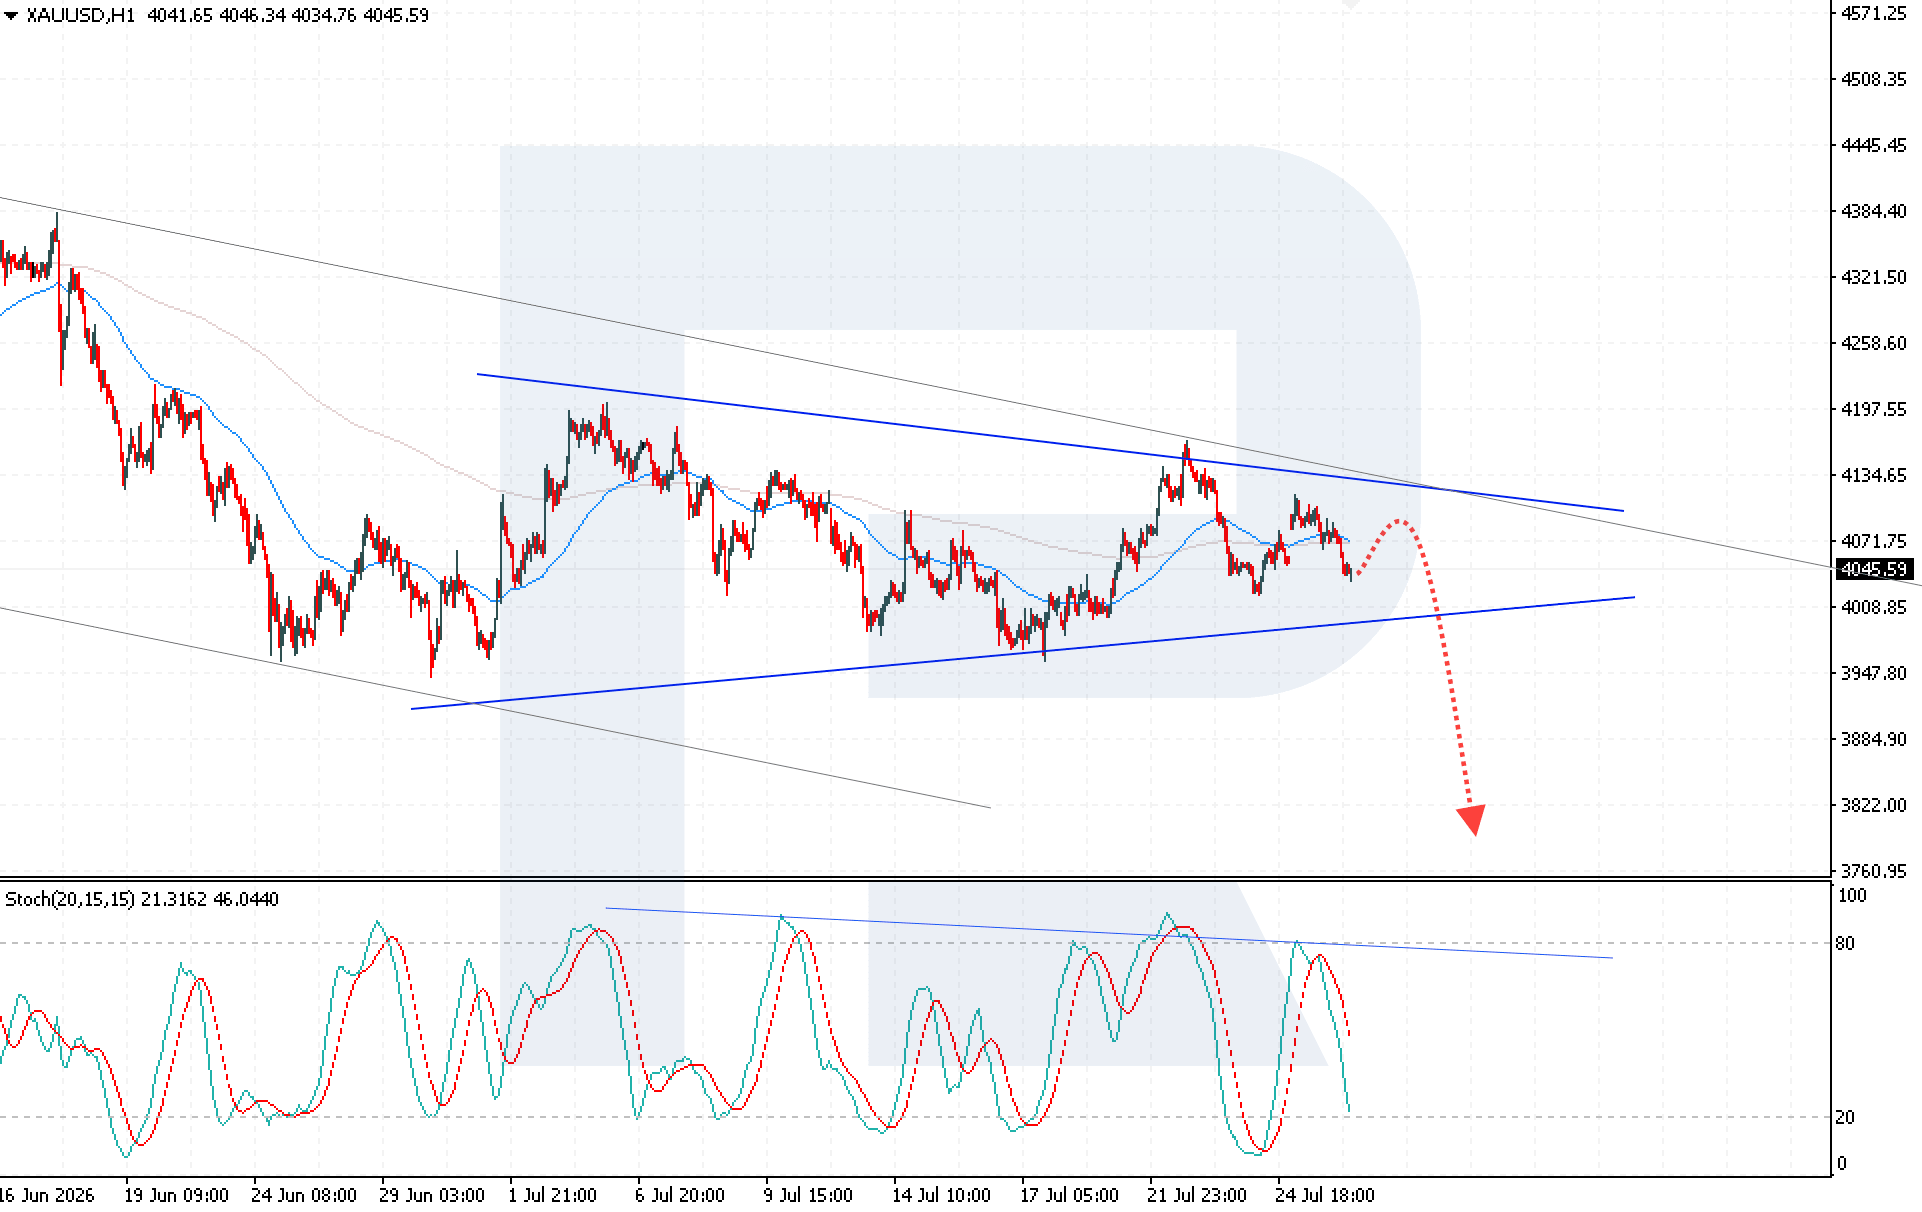
XAUUSD trading scenarios for today
Main scenario (Sell Stop)
A breakout below the lower boundary of the Triangle pattern, followed by consolidation below 3,965 USD, would create conditions for opening short positions and increase selling pressure.
- Take Profit: 3,825
- Stop Loss: 4,075
Alternative scenario (Buy Stop)
A breakout above the upper boundary of the Triangle pattern, followed by consolidation above 4,135, would indicate the end of the downward momentum and the development of an upward move.
- Take Profit: 4,335
- Stop Loss: 4,070
Risk factors
Risks to the XAUUSD bearish scenario are associated with a potential return above the EMA-65 and a breakout above the Triangle pattern’s upper boundary at 4,135 USD. In this case, selling pressure would ease, and buyers would receive a signal to resume the upward movement, with the prospect of further growth.
Summary
XAUUSD prices remain under bearish pressure after consolidating below the EMA-65, while approaching the lower boundary of the Triangle pattern increases the risk of a further decline. A breakout below 3,965 USD would strengthen the downward momentum.
Editors’ picks

EURUSD forecast 2026–2027: technical analysis, price levels & predictions
EURUSD has pulled back from the 2026 high of 1.1915 and is now trading near 1.1450 — below both EMA65 and EMA200 — with the active scenario shifting from bullish to bearish. The ECB raised rates to 2.40%, but the Fed holds at 3.75%, and US inflation (3.5%) continues to outpace the eurozone (2.8%). A confirmed break below 1.1280 opens the next downward wave toward 1.1080. We break down the key levels, three trading scenarios with entry triggers, and what Deutsche Bank, Morgan Stanley and UBS are forecasting for EURUSD in 2026.

Gold (XAUUSD) forecast 2026: predictions based on fundamental and technical analysis
Gold has corrected over 25% from its all-time high of 5,597 USD and is now trading near 4,100 USD — testing a critical support zone. Is this the bottom, or will the downtrend continue? We break down the key levels (support 3,920 USD, breakout trigger 4,500 USD), three trading scenarios with entry levels, and what J.P. Morgan, Goldman Sachs and Deutsche Bank are forecasting for gold in 2026.
Ang mga pagtataya na ipinakita sa seksyong ito ay nagpapakita lamang ng pribadong opinyon ng may-akda at hindi dapat ituring bilang gabay para sa pagtetrade. Walang pananagutan ang RoboForex para sa mga resulta ng pagtetrade batay sa mga rekomendasyon sa pagtetrade na inilarawan sa mga analytical review na ito.