
XAUUSD declines amid rising oil prices and Fed rate hike expectations
Gold (XAUUSD) remains under pressure after two sessions of declines due to rising oil prices and heightened inflation risks, with prices currently at 4,379 USD. Discover more in our analysis for 9 September 2026.
XAUUSD forecast: key takeaways
- Rising oil prices are fuelling inflation concerns and supporting expectations of a Federal Reserve interest rate hike
- The likelihood of a 25-basis-point Federal Reserve rate hike next week is estimated at around 60%
- XAUUSD forecast for 9 September 2026: 4,310
Fundamental analysis
Gold (XAUUSD) prices remain under selling pressure. The main factor is rising oil prices, which are increasing inflation risks and supporting expectations of tighter monetary policy from the Federal Reserve.
Oil prices are rising after US forces destroyed five Iranian crude oil tankers near Kharg Island, Iran’s key export hub. Escalating geopolitical tensions create additional risks to oil supplies and may keep inflationary pressure elevated.
The market is also focused on upcoming US inflation data. The new figures should give investors more information about the Federal Reserve’s next decision. Markets currently estimate the likelihood of a 25-basis-point rate hike next week at 60%.
High interest rates traditionally put pressure on gold, as the metal does not generate interest income and becomes less attractive compared to yield-bearing assets. At the same time, XAUUSD continues to receive medium-term support from investment and safe-haven demand, as well as central bank gold purchases, particularly by China.
The gold (XAUUSD) outlook is moderately bearish.
Technical outlook
On the H4 timeframe, XAUUSD quotes maintain a downward trajectory after correcting from the August highs. Prices remain below the middle Bollinger Band around 4,418 USD, while the recovery attempt in early September failed to gain traction. The nearest support level is located at 4,360 USD, with the next target for sellers at 4,310 USD.
MACD remains below zero, indicating continued bearish momentum. The Stochastic Oscillator is near oversold territory, so a short-term rebound is possible before the decline resumes. However, as long as prices remain below 4,418 USD, sellers retain the advantage.
The main scenario suggests a continued decline after consolidation below 4,360 USD, targeting the 4,310 USD area. An alternative scenario would come into play if prices return above 4,420 USD. In this case, XAUUSD could continue to recover towards the next resistance level at 4,470 USD.
XAUUSD overview
- Asset: XAUUSD
- Timeframe: H4 (intraday)
- Trend: bearish
- Key resistance levels: 4,418 and 4,473
- Key support levels: 4,360 and 4,310
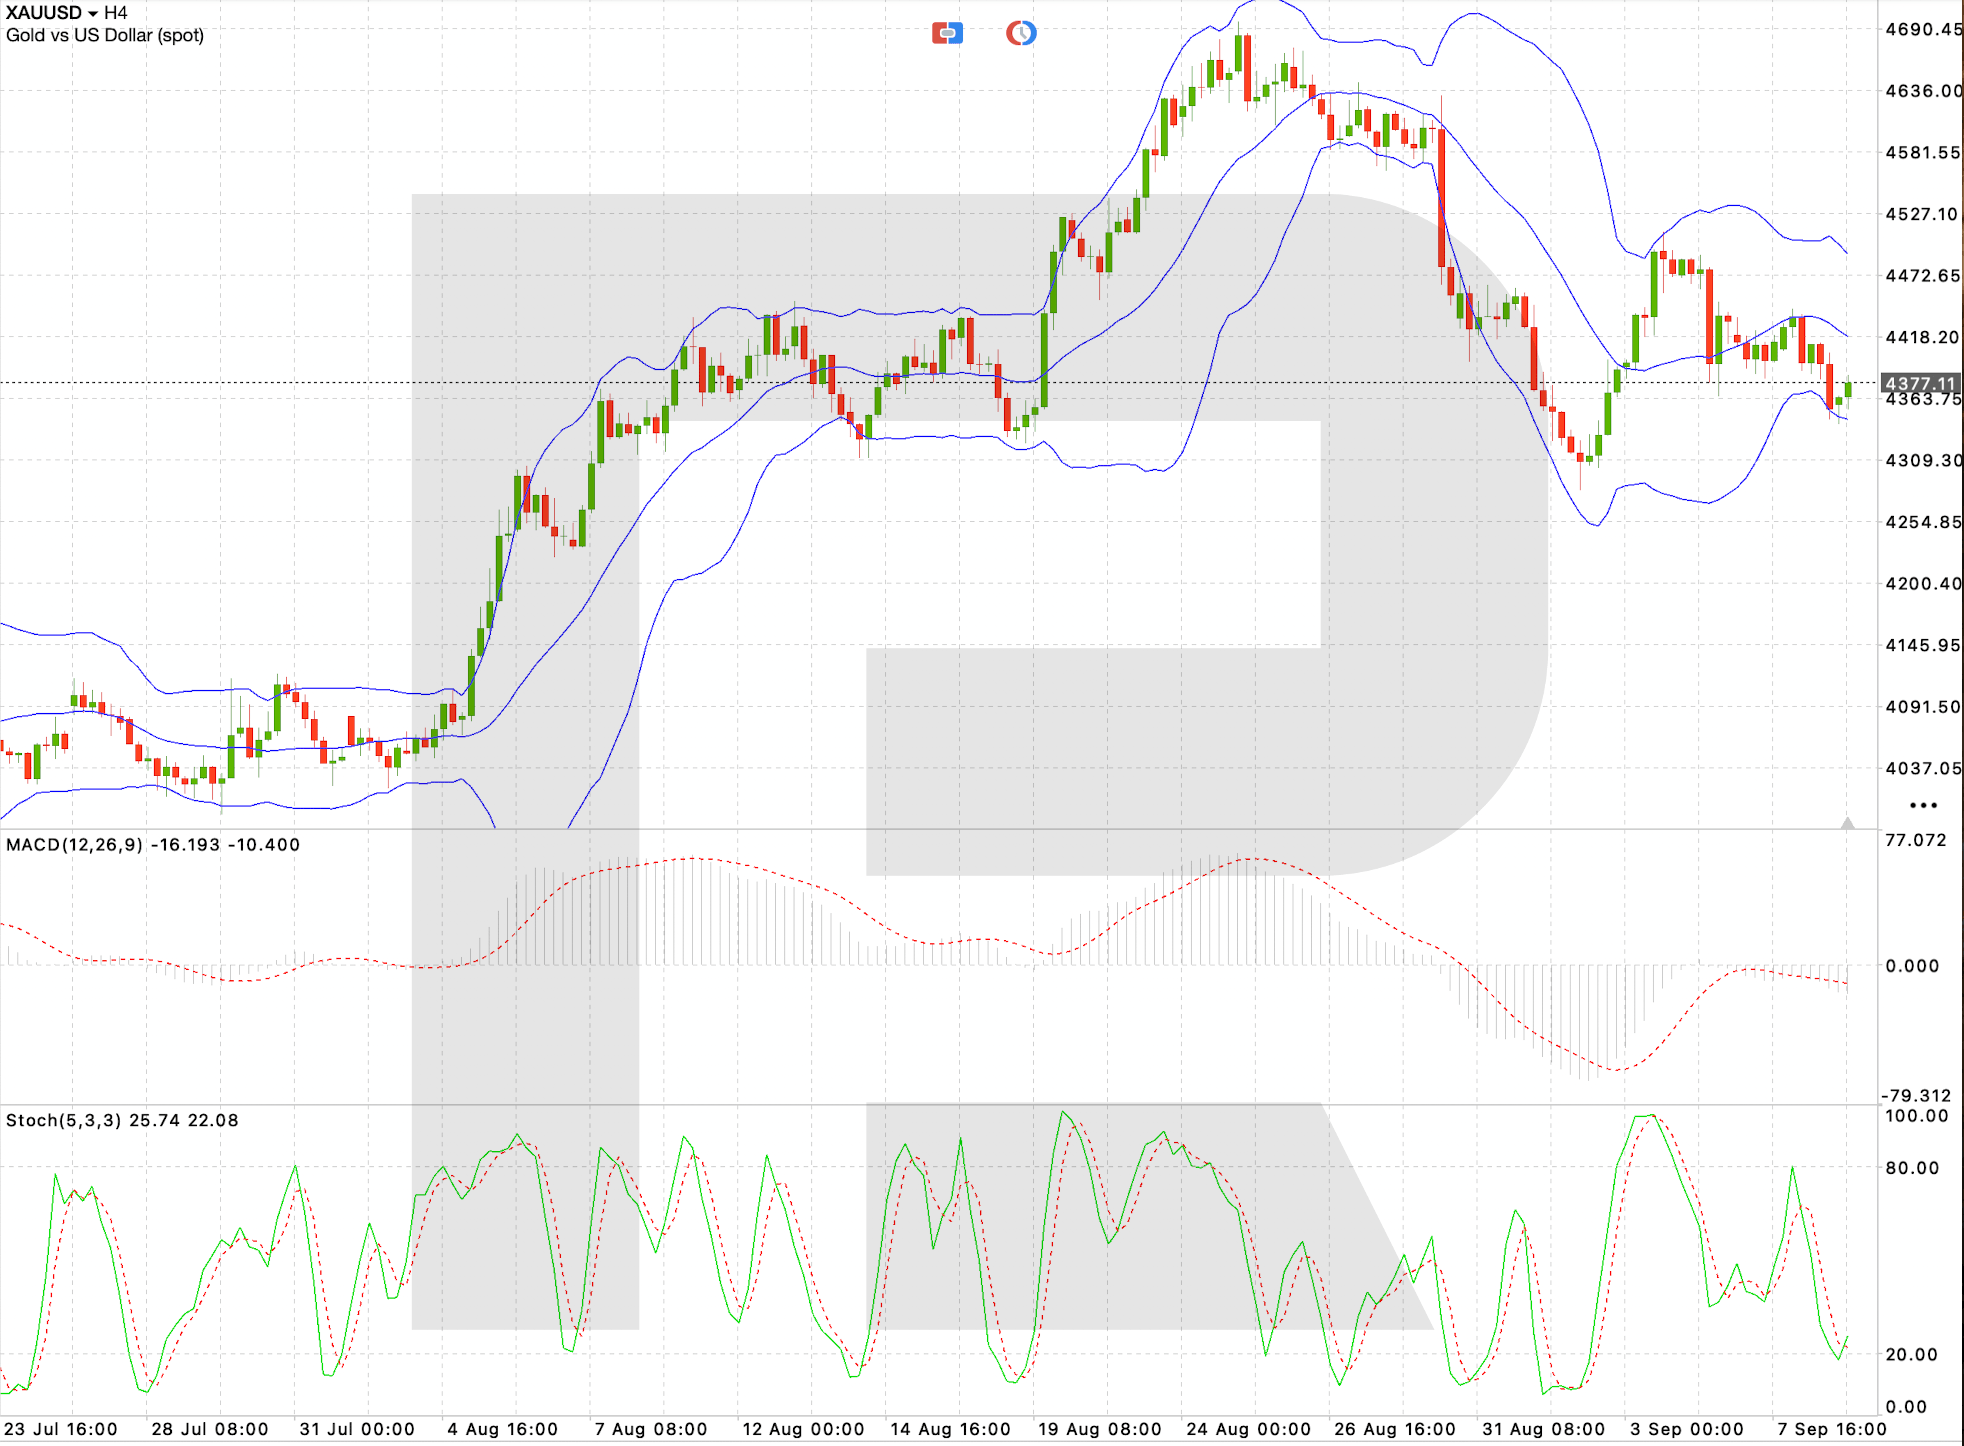
XAUUSD trading scenario for today
Trading scenario (Sell Stop)
A breakout below a local support level, followed by consolidation below 4,360 USD, would confirm continued bearish momentum and create conditions for opening short positions.
- Current price: 4,379
- Entry level: 4,355
- Take profit: 4,305
- Stop loss: 4,385
- Risk-to-reward ratio: 1:1.7
The trade idea is valid until 8:00 AM on 10 September 2026 (server time, UTC+3).
Risk factors
The main risk to the XAUUSD downside scenario is weaker-than-expected US inflation data. Signs of easing price pressures could reduce expectations of a Federal Reserve rate hike and support demand for gold. Geopolitical tensions surrounding Iran also remain an additional risk factor: further escalation could increase demand for safe-haven assets and bring buyers back towards the 4,418 USD resistance level.
Summary
XAUUSD maintains a downward bias after two sessions of declines, while the technical picture on the H4 chart continues to favour sellers. Rising oil prices are fuelling inflation concerns and supporting expectations of a Federal Reserve rate hike, limiting demand for gold. Consolidation below 4,360 USD would confirm the bearish scenario and open the way towards the 4,310–4,305 USD area. A return above 4,418 USD would reduce selling pressure and increase the likelihood of a recovery towards 4,473 USD.
Editors’ picks

EURUSD forecast 2026–2027: technical analysis, price levels & predictions
EURUSD has recovered from the July lows and is trading near 1.1545 — back in bullish territory. The pair has reclaimed EMA65 on the daily, formed a bullish EMA crossover on H4, and the US-eurozone GDP gap has narrowed sharply (US 1.5% vs eurozone 1.0%). Goldman Sachs and Deutsche Bank both now target 1.2500 by year-end. A confirmed close above 1.1700 opens the path to 1.1805. We break down the key levels, three trading scenarios, and what the unprecedented 9-3 FOMC dissent vote means for EURUSD.

Gold (XAUUSD) forecast 2026: technical analysis, price levels & predictions
Gold has reversed its downtrend and is trading near 4,360 USD, back above both EMA65 and EMA200. ETF flows turned positive in July with 3 billion USD of net inflows, and central banks bought 288.9 tonnes in Q2 — up 62% year-on-year. A breakout above 4,500 USD opens the path to 4,855 USD and the 5,597 USD all-time high. We break down the key levels, three trading scenarios with entry triggers, and what J.P. Morgan, Deutsche Bank and Goldman Sachs are forecasting for gold in 2026.
Ang mga pagtataya na ipinakita sa seksyong ito ay nagpapakita lamang ng pribadong opinyon ng may-akda at hindi dapat ituring bilang gabay para sa pagtetrade. Walang pananagutan ang RoboForex para sa mga resulta ng pagtetrade batay sa mga rekomendasyon sa pagtetrade na inilarawan sa mga analytical review na ito.