
Bitcoin (BTCUSD) stays positive as buyers focus on further gains
Bitcoin (BTCUSD) rose to 65,126 USD, with risk assets supported by US economic data. For more details, see our analysis for 10 August 2026.
BTCUSD forecast: key takeaways
- The Bitcoin (BTCUSD) price maintains its upward momentum
- US data worsened the outlook for Federal Reserve monetary policy
- BTCUSD forecast for 10 August 2026: 65,340
Fundamental analysis
Bitcoin (BTCUSD) is trading near 65,126 USD. The fundamental backdrop for BTCUSD remains moderately positive following a weak US labour market report. In July, employment fell by 23 thousand versus an expected increase of 80 thousand, while the May and June figures were revised down by a combined 103 thousand. Unemployment remained near 4.1%, while labour force participation stood at 61.4%.
The weak data significantly reduced expectations of tighter Federal Reserve policy, with the likelihood of a September rate hike falling to around 40% from 55% before the data release. Treasury yields declined, and the dollar came under pressure, creating generally more favourable conditions for Bitcoin and other risk assets.
However, the cryptocurrency market also received a negative signal. The US Senate postponed consideration of the Clarity Act until September, prolonging uncertainty around digital asset regulation. The bill is intended to define regulators’ powers in the cryptocurrency market, making the delay particularly important for exchanges and institutional participants.
Bitcoin’s (BTCUSD) reaction to the news has so far been muted: the weak labour market has not triggered a strong rally, while the delay to the bill has not led to any significant sell-off either, indicating a relative balance between supply and demand. The main risk remains a further deterioration in the US economy: if weak employment is perceived as a recession threat, the positive impact of lower rate expectations could quickly give way to a broader decline in risk appetite.
The Bitcoin (BTCUSD) forecast is moderately positive.
Technical outlook
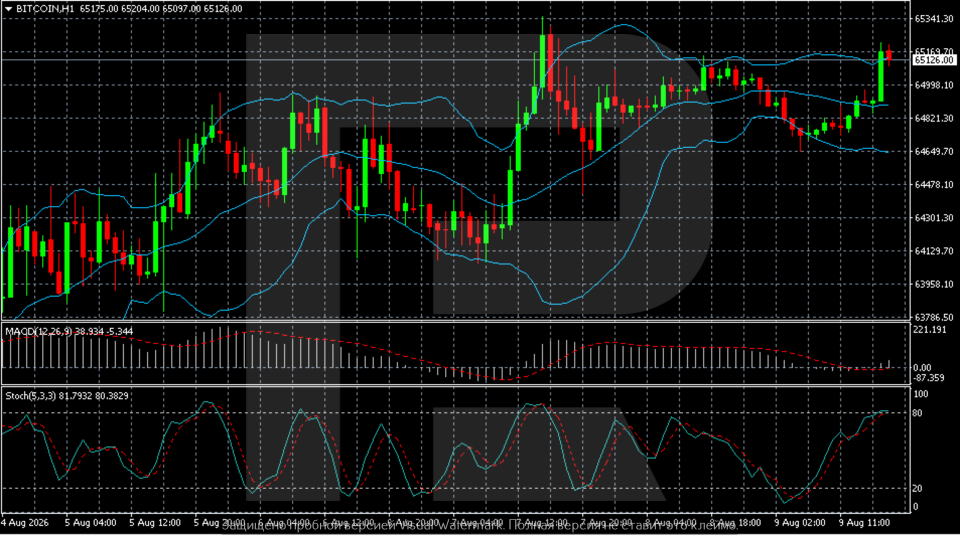
On the H1 chart, BTCUSD maintains its upward momentum and is trading near 65,126. After recovering from the 64,650–64,800 zone, the price returned above the middle Bollinger Band and approached the indicator’s upper boundary. The short-term structure remains bullish, although the market has already approached the area of local highs.
The nearest resistance level is located in the 65,170–65,340 zone. Consolidation above 65,340 would confirm continued growth and open the way for new upward momentum. Support levels lie at 65,000 and 64,820, with a stronger zone below near 64,650. As long as BTC remains above 64,820–65,000, buyers have the upper hand.
MACD is turning upwards, confirming a recovery in upward momentum. The Stochastic Oscillator has risen above 80 and entered overbought territory, so a pause or local pullback is possible at current levels. The baseline scenario remains a move within the 65,000–65,340 range with a moderately positive bias.
BTCUSD overview
- Asset: BTCUSD
- Timeframe: H1 (intraday)
- Trend: bullish
- Key resistance levels: 65,340 and 66,020
- Key support levels: 65,000 and 64,820
Bitcoin trading scenarios for today
Main scenario (Buy Stop)
A breakout and consolidation above the 65,340 USD resistance level would confirm continued upward momentum in BTCUSD and create conditions for a move towards the next target.
- Take Profit: 66,020
- Stop Loss: 65,000
Alternative scenario (Sell Stop)
A breakout and consolidation below the 64,820 USD support level would indicate weakening buying pressure and a correction towards the next support zone.
- Take Profit: 64,650
- Stop Loss: 65,050
Risk factors
The main risk to the BTCUSD bullish scenario remains overbought conditions after the recent rise and buyers’ failure to consolidate above 65,340 USD. Renewed expectations of tighter Federal Reserve policy or a deterioration in global risk appetite could add to pressure. At the same time, weak US data and lower yields continue to support Bitcoin.
Summary
The Bitcoin price is moving higher as the market focuses on positive signals and ignores the delay to the Clarity Act. The BTCUSD forecast for today, 10 August 2026, suggests a rise towards 65,340.
Editors’ picks

EURUSD forecast 2026–2027: technical analysis, price levels & predictions
EURUSD has pulled back from the 2026 high of 1.1915 and is now trading near 1.1450 — below both EMA65 and EMA200 — with the active scenario shifting from bullish to bearish. The ECB raised rates to 2.40%, but the Fed holds at 3.75%, and US inflation (3.5%) continues to outpace the eurozone (2.8%). A confirmed break below 1.1280 opens the next downward wave toward 1.1080. We break down the key levels, three trading scenarios with entry triggers, and what Deutsche Bank, Morgan Stanley and UBS are forecasting for EURUSD in 2026.

Gold (XAUUSD) forecast 2026: predictions based on fundamental and technical analysis
Gold has corrected over 25% from its all-time high of 5,597 USD and is now trading near 4,100 USD — testing a critical support zone. Is this the bottom, or will the downtrend continue? We break down the key levels (support 3,920 USD, breakout trigger 4,500 USD), three trading scenarios with entry levels, and what J.P. Morgan, Goldman Sachs and Deutsche Bank are forecasting for gold in 2026.
Ang mga pagtataya na ipinakita sa seksyong ito ay nagpapakita lamang ng pribadong opinyon ng may-akda at hindi dapat ituring bilang gabay para sa pagtetrade. Walang pananagutan ang RoboForex para sa mga resulta ng pagtetrade batay sa mga rekomendasyon sa pagtetrade na inilarawan sa mga analytical review na ito.