
Kevin Warsh’s hawkish stance weighs on BTCUSD
BTCUSD is undergoing a correction, remaining under pressure following the Jackson Hole Symposium. The price currently stands at 78,212. Discover more in our analysis for 31 August 2026.
BTCUSD forecast: key takeaways
- The market has priced in two Federal Reserve interest rate hikes before the end of this year
- BTCUSD is ending August 2026 with a gain of 24%, one of the best performances for this month in history
- BTCUSD forecast for 31 August 2026: 84,565
Fundamental analysis
The BTCUSD rate is undergoing a downward correction today, with buyers keeping the price above the local 77,255 USD support level. Bearish pressure persists following the hawkish outcome of the Jackson Hole Economic Symposium.
Federal Reserve Chairman Kevin Warsh’s speech was much more hawkish than the market expected. The head of the regulator explicitly identified PCE inflation as the main benchmark and described current financial conditions as too loose to combat it, prompting market participants to price in two interest rate hikes before the end of this year. Higher rates traditionally restrict liquidity flows into risk assets, including the cryptocurrency sector.
An additional negative factor was the sharp escalation of geopolitical tensions in the Middle East following mutual military strikes between the US and Iran over the weekend. Donald Trump’s statements about readiness to attack Iran’s key oil hub and the Treasury’s plans to impose new tough sanctions triggered a sharp rise in Brent crude oil prices, intensifying global inflation concerns and reducing investors’ risk appetite. Nevertheless, despite the local decline, BTCUSD is ending August 2026 with an impressive gain of 24%, one of the best performances for this month in history.
Technical outlook
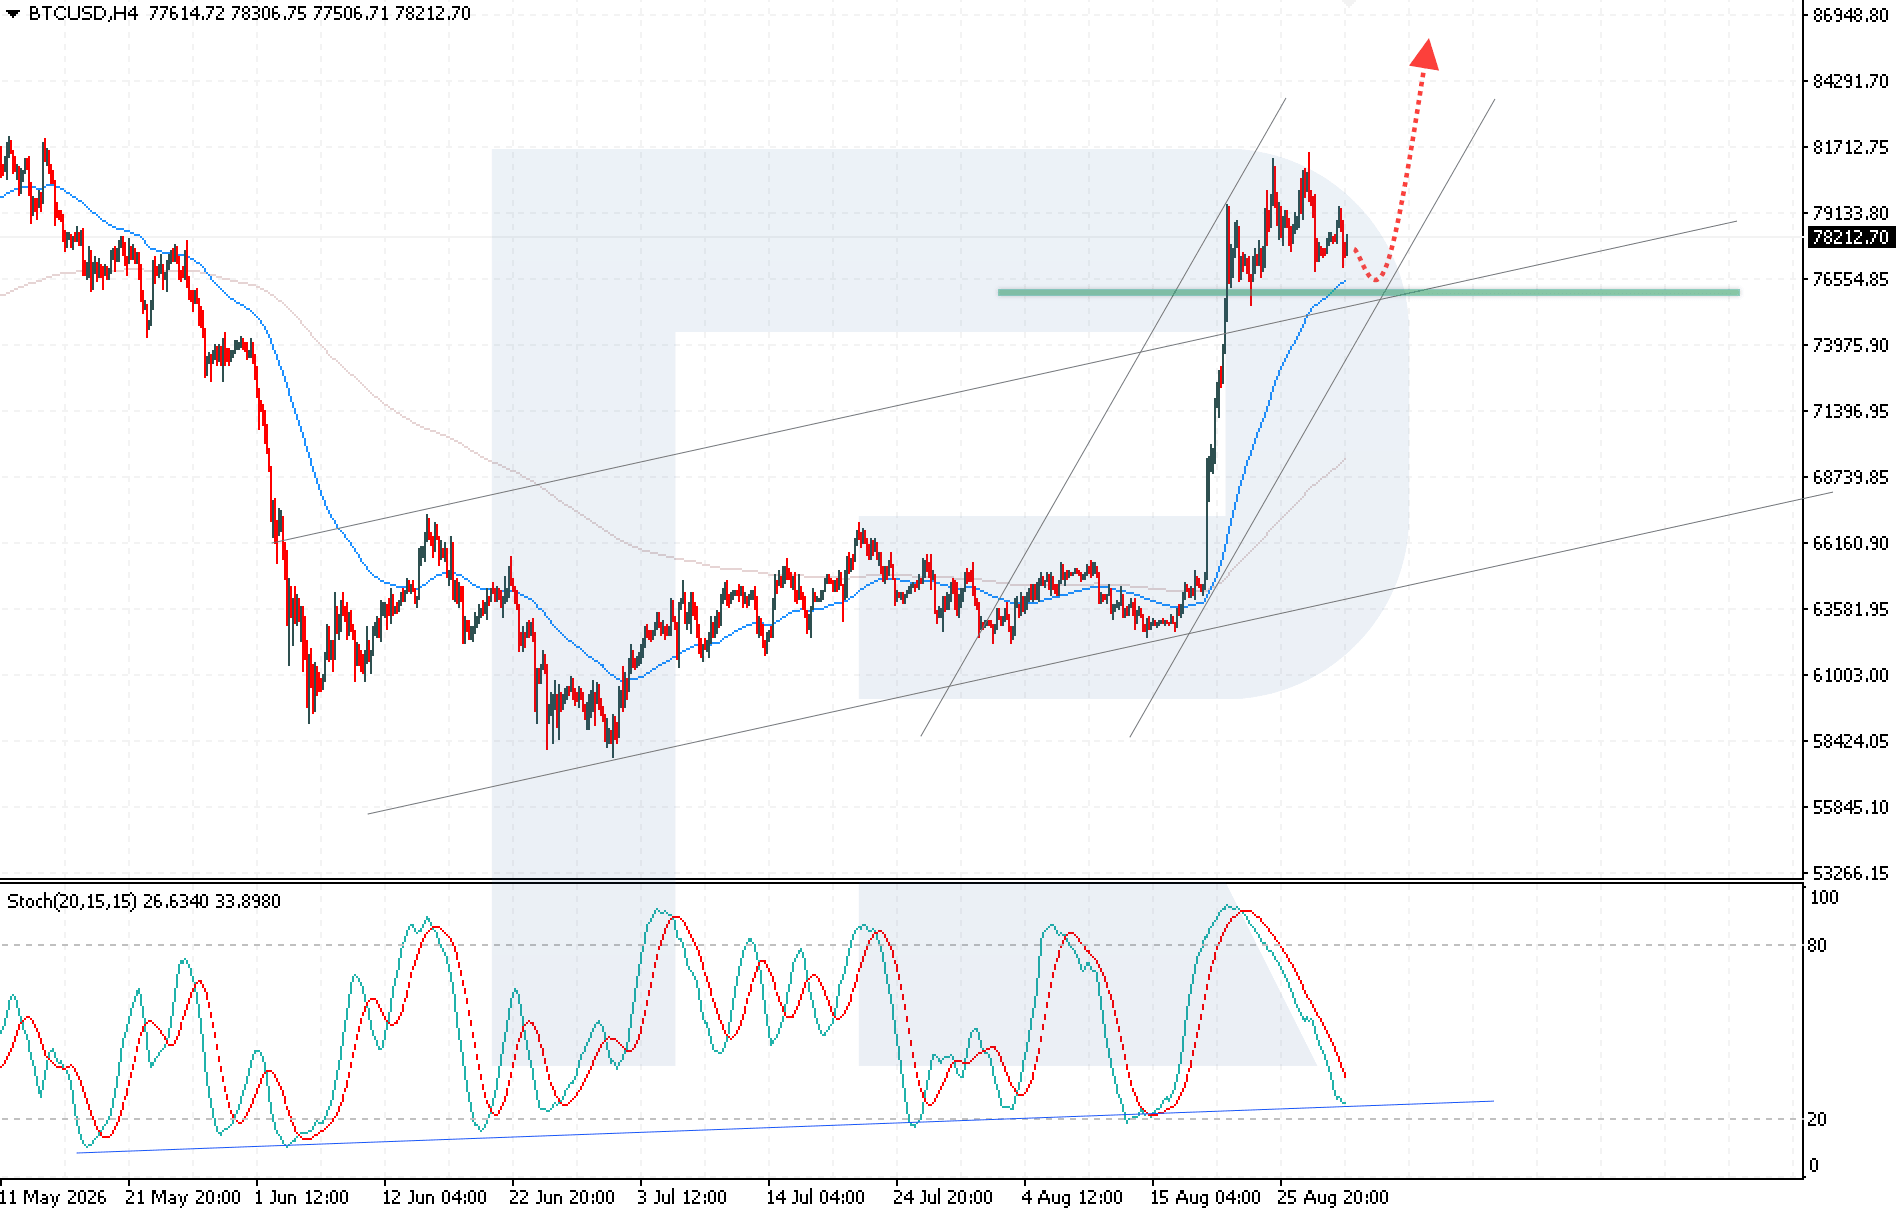
BTCUSD quotes are holding above the local support level and remain above the EMA-65, indicating growing buying pressure. Today’s BTCUSD forecast suggests continued upward momentum towards the 84,565 USD target.
The technical picture remains favourable for further growth. The Stochastic Oscillator has reached the support line, confirming the end of the current consolidation phase. A confident breakout above 79,560 USD, followed by consolidation above this level, would provide an additional signal in favour of continued growth.
At the same time, an alternative scenario remains possible. If the price breaks below the lower boundary of the ascending channel and consolidates below 76,405 USD, this would signal weakening buying activity and increase the likelihood of a downward correction.
BTCUSD overview
- Asset: BTCUSD
- Timeframe: H4
- Trend: bullish
- Key resistance levels: 79,560 and 81,650
- Key support levels: 77,250 and 76,405
Bitcoin trading scenarios for today
Main scenario (Buy Stop)
A breakout above the local 79,560 USD resistance level would increase buying pressure and signal the end of the current consolidation, creating conditions for opening long positions in BTCUSD.
- Current price: 78,212
- Entry level: 79,560
- Take profit: 84,565
- Stop loss: 77,805
- Risk-to-reward ratio: more than 1:2
Alternative scenario (Sell Stop)
A decline and breakout below the 76,405 USD support level would indicate a breakout from the bullish channel and easing buying pressure, with a downward momentum developing.
- Entry level: 76,405
- Take profit: 70,205
- Stop loss: 79,355
- Risk-to-reward ratio: more than 1:2
The trade idea is valid until 8:00 AM on 1 September 2026 (server time, UTC+3).
Risk factors
The main risks to the BTCUSD bullish scenario are the Federal Reserve’s tight monetary policy and an escalation of the geopolitical conflict in the Middle East. These factors are driving liquidity out of risk assets and into safe-haven assets, which could push BTCUSD below the 77,255 USD support level.
Summary
The hawkish rhetoric of new Federal Reserve Chairman Kevin Warsh triggered a BTCUSD correction towards the 77,255 USD support level. However, strong fundamental momentum allowed Bitcoin to end August 2026 with a gain of 24%, maintaining investors’ long-term optimism.
Editors’ picks

EURUSD forecast 2026–2027: technical analysis, price levels & predictions
EURUSD has recovered from the July lows and is trading near 1.1545 — back in bullish territory. The pair has reclaimed EMA65 on the daily, formed a bullish EMA crossover on H4, and the US-eurozone GDP gap has narrowed sharply (US 1.5% vs eurozone 1.0%). Goldman Sachs and Deutsche Bank both now target 1.2500 by year-end. A confirmed close above 1.1700 opens the path to 1.1805. We break down the key levels, three trading scenarios, and what the unprecedented 9-3 FOMC dissent vote means for EURUSD.

Gold (XAUUSD) forecast 2026: technical analysis, price levels & predictions
Gold has reversed its downtrend and is trading near 4,360 USD, back above both EMA65 and EMA200. ETF flows turned positive in July with 3 billion USD of net inflows, and central banks bought 288.9 tonnes in Q2 — up 62% year-on-year. A breakout above 4,500 USD opens the path to 4,855 USD and the 5,597 USD all-time high. We break down the key levels, three trading scenarios with entry triggers, and what J.P. Morgan, Deutsche Bank and Goldman Sachs are forecasting for gold in 2026.
Ang mga pagtataya na ipinakita sa seksyong ito ay nagpapakita lamang ng pribadong opinyon ng may-akda at hindi dapat ituring bilang gabay para sa pagtetrade. Walang pananagutan ang RoboForex para sa mga resulta ng pagtetrade batay sa mga rekomendasyon sa pagtetrade na inilarawan sa mga analytical review na ito.