
Dogecoin (DOGEUSD) corrects within a Wedge pattern
The Dogecoin price is correcting after yesterday’s rise, although buyers continue to hold it above the key support level. The current quote is 0.07011. For more details, see our analysis for 31 July 2026.
DOGEUSD forecast: key takeaways
- July has historically been a weak month for Dogecoin, with the coin losing an average of 4.6% during this period
- Open interest in DOGE has nearly halved, reducing the volume of speculative positions
- DOGEUSD forecast for 31 July 2026: 0.07790
Fundamental analysis
The DOGEUSD price is correcting after yesterday’s rise, although quotes remain below the key resistance level of 0.07100. Historically, July has been one of the weakest months for Dogecoin, with an average decline of around 4.6%, which adds further pressure to market sentiment.
From a fundamental perspective, the asset continues to face challenges arising from its tokenomics. Annual issuance of around 5.2 billion new DOGE means that the market requires a constant inflow of capital, equivalent to approximately 14 million DOGE in net purchases per day, merely to maintain the current price level. In the absence of strong news-driven catalysts, this creates persistent underlying pressure on quotes.
At the same time, market conditions are gradually improving. More than 130 million USD worth of long positions were liquidated in June and July, significantly reducing market overheating. Open interest also nearly halved, reducing the amount of speculative capital and creating more favourable conditions for organic growth.
Despite the current correction, DOGEUSD continues to hold above the key support level of 0.06850. If buyers manage to defend this level and the fundamental backdrop improves due to new positive developments, this could act as a catalyst for a recovery and a return of upward momentum.
Technical outlook
The Dogecoin price is declining within a Wedge reversal pattern. Quotes remain below the EMA-65, indicating continued selling pressure. Today’s Dogecoin forecast suggests that the current correction may end, followed by renewed growth towards 0.07790.
The technical picture continues to favour the bullish scenario. The Stochastic Oscillator turned upwards after rebounding from the ascending trendline, increasing the likelihood of renewed buying. A breakout above the upper boundary of the Wedge reversal pattern, followed by consolidation above 0.07335, would further confirm the upward movement.
An alternative scenario would come into play if selling activity intensifies. For this scenario to develop, the price would need to break below the local support level and consolidate below 0.06605. In this case, the bullish scenario would be invalidated, and Dogecoin would continue to decline.
DOGEUSD overview
- Asset: DOGEUSD
- Timeframe: H1 (intraday)
- Trend: sideways
- Key resistance levels: 0.07330 and 0.07650
- Key support levels: 0.06880 and 0.06750
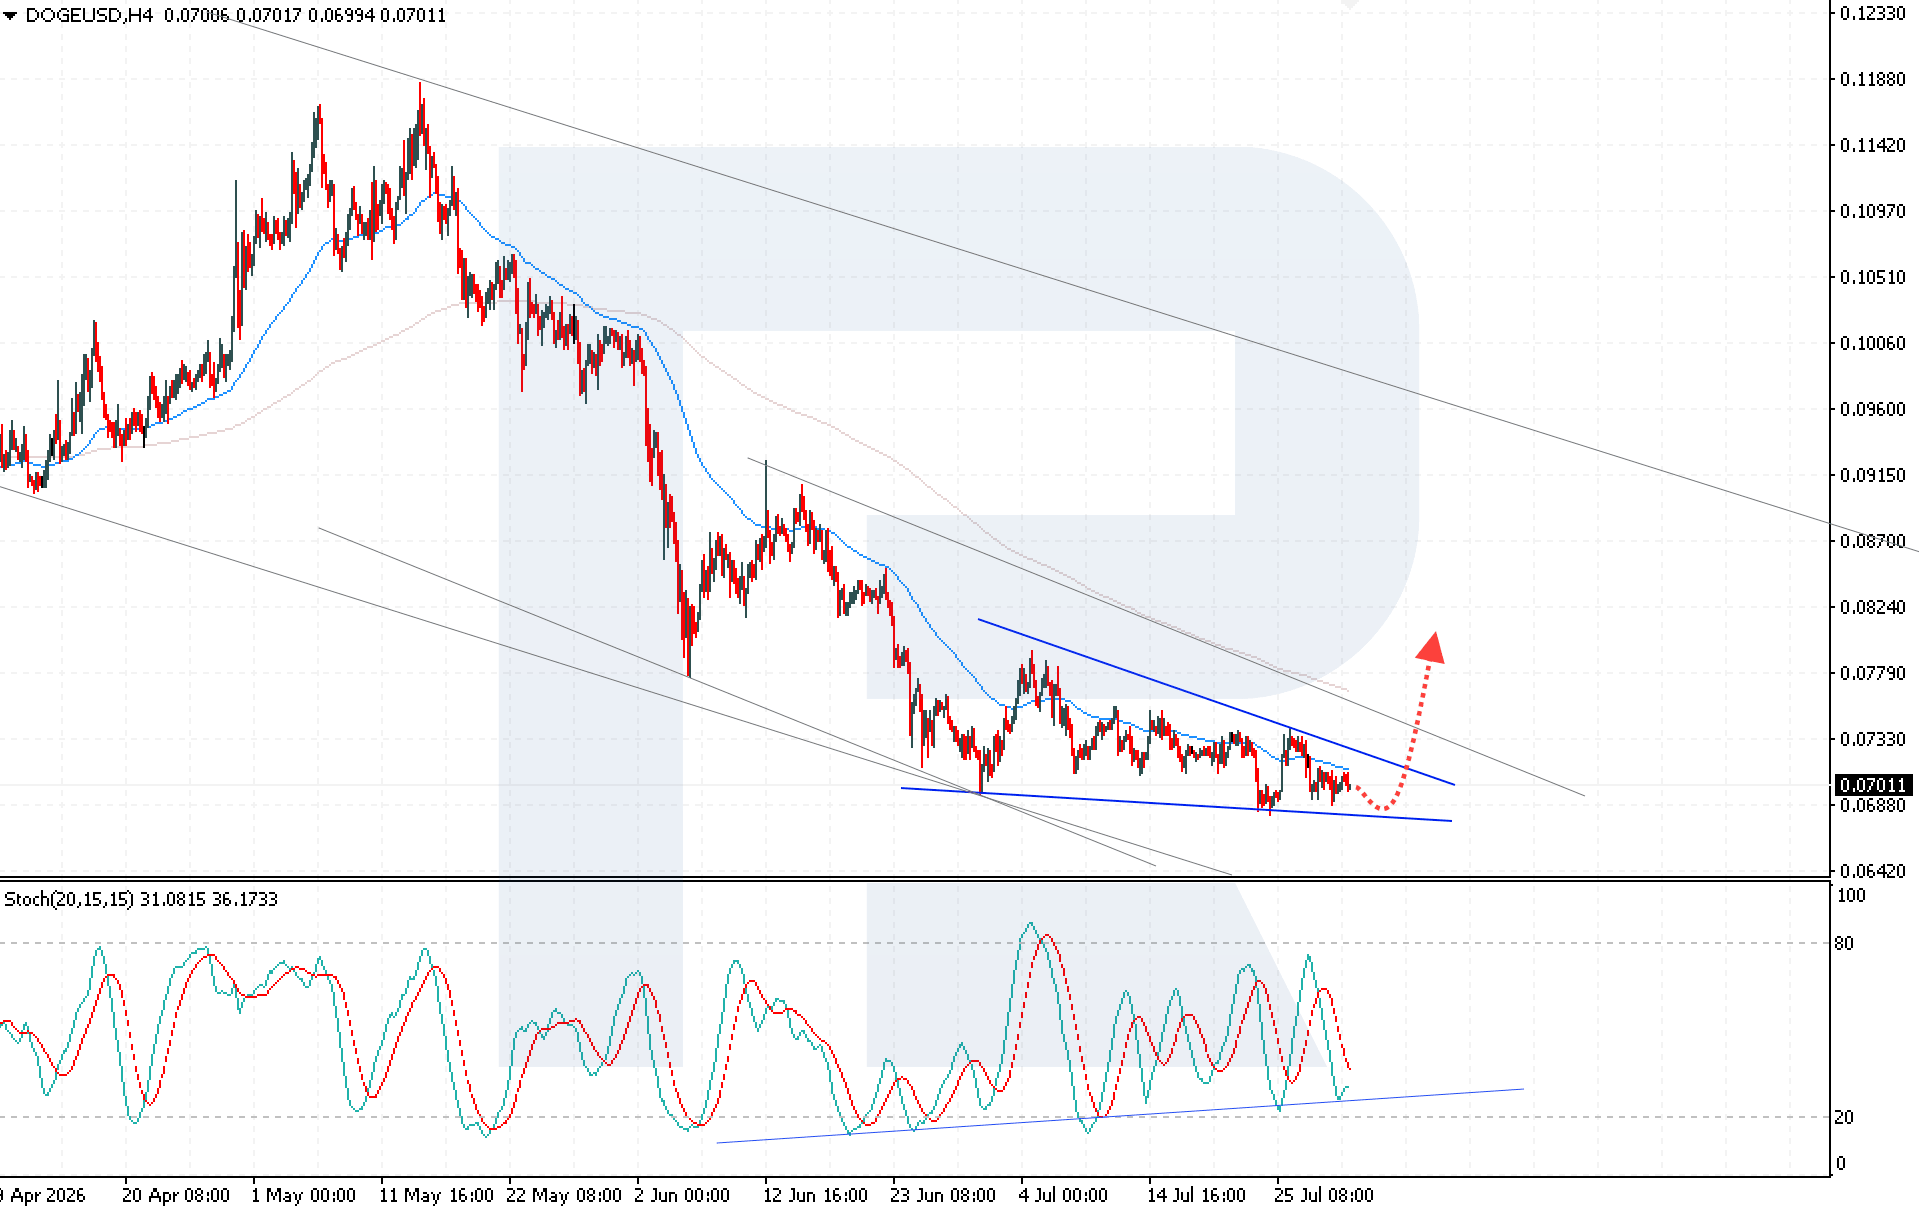
Dogecoin trading scenarios for today
Main scenario (Buy Stop)
A breakout above the upper boundary of the Wedge pattern and consolidation above 0.07335 would indicate the completion of the sideways correction and the beginning of the pattern’s development towards the 0.07790 target.
- Take Profit: 0.07790
- Stop Loss: 0.07005
Alternative scenario (Sell Stop)
A breakout below the local support level and consolidation below 0.06605 would indicate that the reversal pattern is no longer forming and that the decline may continue towards 0.06465.
- Take Profit: 0.06420
- Stop Loss: 0.07005
Risk factors
The main risk to the bullish scenario remains continued selling pressure below the EMA-65 and DOGEUSD’s failure to break above the 0.07335 resistance level, which could lead to a further correction.
Summary
Despite the current correction and continued selling pressure, the technical and fundamental picture continues to indicate recovery potential for Dogecoin as long as the 0.06850 support level holds. A breakout above the upper boundary of the Wedge pattern and consolidation above 0.07335 would provide important signals in favour of a new upward impulse towards 0.07790.
Editors’ picks

EURUSD forecast 2026–2027: technical analysis, price levels & predictions
EURUSD has pulled back from the 2026 high of 1.1915 and is now trading near 1.1450 — below both EMA65 and EMA200 — with the active scenario shifting from bullish to bearish. The ECB raised rates to 2.40%, but the Fed holds at 3.75%, and US inflation (3.5%) continues to outpace the eurozone (2.8%). A confirmed break below 1.1280 opens the next downward wave toward 1.1080. We break down the key levels, three trading scenarios with entry triggers, and what Deutsche Bank, Morgan Stanley and UBS are forecasting for EURUSD in 2026.

Gold (XAUUSD) forecast 2026: predictions based on fundamental and technical analysis
Gold has corrected over 25% from its all-time high of 5,597 USD and is now trading near 4,100 USD — testing a critical support zone. Is this the bottom, or will the downtrend continue? We break down the key levels (support 3,920 USD, breakout trigger 4,500 USD), three trading scenarios with entry levels, and what J.P. Morgan, Goldman Sachs and Deutsche Bank are forecasting for gold in 2026.
Ang mga pagtataya na ipinakita sa seksyong ito ay nagpapakita lamang ng pribadong opinyon ng may-akda at hindi dapat ituring bilang gabay para sa pagtetrade. Walang pananagutan ang RoboForex para sa mga resulta ng pagtetrade batay sa mga rekomendasyon sa pagtetrade na inilarawan sa mga analytical review na ito.