
Major players continue to accumulate Ethereum: ETH could surprise the market
After a sharp rise, the price continues to consolidate as part of a correction, currently trading at 2,444.00. Discover more in our analysis for 1 September 2026.
ETHUSD forecast: key takeaways
- Inflows into spot ETFs remain one of Ethereum’s main drivers
- The emergence of staking products addresses one of the main drawbacks of the first Ethereum ETFs
- ETHUSD forecast for 1 September 2026: 2,415.00 and 2,530.00
Fundamental analysis
Today’s Ethereum price forecast takes into account that the price is trading around 2,444.00 USD while forming a correction.
Inflows into spot ETFs remain one of Ethereum’s main drivers. Corporate reserves are providing additional support: BitMine continues to actively accumulate ETH, with its total holdings approaching 5.9 million ETH. This reduces the number of coins available on the market and strengthens the institutional narrative around Ethereum.
Around 34% of the ETH supply is already staked, equivalent to approximately 41 million coins. At the same time, the development of US staking ETFs is making Ethereum more attractive to investors who want to earn a return from holding the asset rather than relying solely on price appreciation.
The emergence of staking products addresses one of the main drawbacks of the first Ethereum ETFs: investors can benefit not only from an increase in the ETH price but also from staking yields. This could potentially broaden the pool of institutional buyers.
Following the recent increase in expectations of a Federal Reserve rate hike, the cryptocurrency market has gained another source of uncertainty. Higher capital costs and US bond yields could limit inflows into ETH and other risk assets.
The ETHUSD forecast for 1 September 2026 takes into account that the main drivers of Ethereum price movements are institutional ETH accumulation, ETF inflows, the development of staking, and Ethereum’s significant role in DeFi and stablecoins. At the same time, further dynamics will depend heavily on Federal Reserve monetary policy: a more hawkish stance could temporarily outweigh the positive factors within the Ethereum ecosystem itself.
Technical outlook
On the H4 chart, the ETHUSD price formed a Hammer reversal pattern near the lower Bollinger Band. At this stage, the price may continue its upward wave as the signal plays out, with the upside target at the 2,530.00 resistance level. A breakout above this mark would open the way for continued upward momentum.
At the same time, today’s ETHUSD technical analysis also suggests another scenario. The price could form a corrective wave and test the 2,415.00 support level. A rebound from this mark could then lead to a continued rise.
ETHUSD overview
- Asset: ETHUSD
- Timeframe: H4 (intraday)
- Trend: bullish
- Key resistance levels: 2,530.00 and 2,665.00
- Key support levels: 2,415.00 and 2,350.00
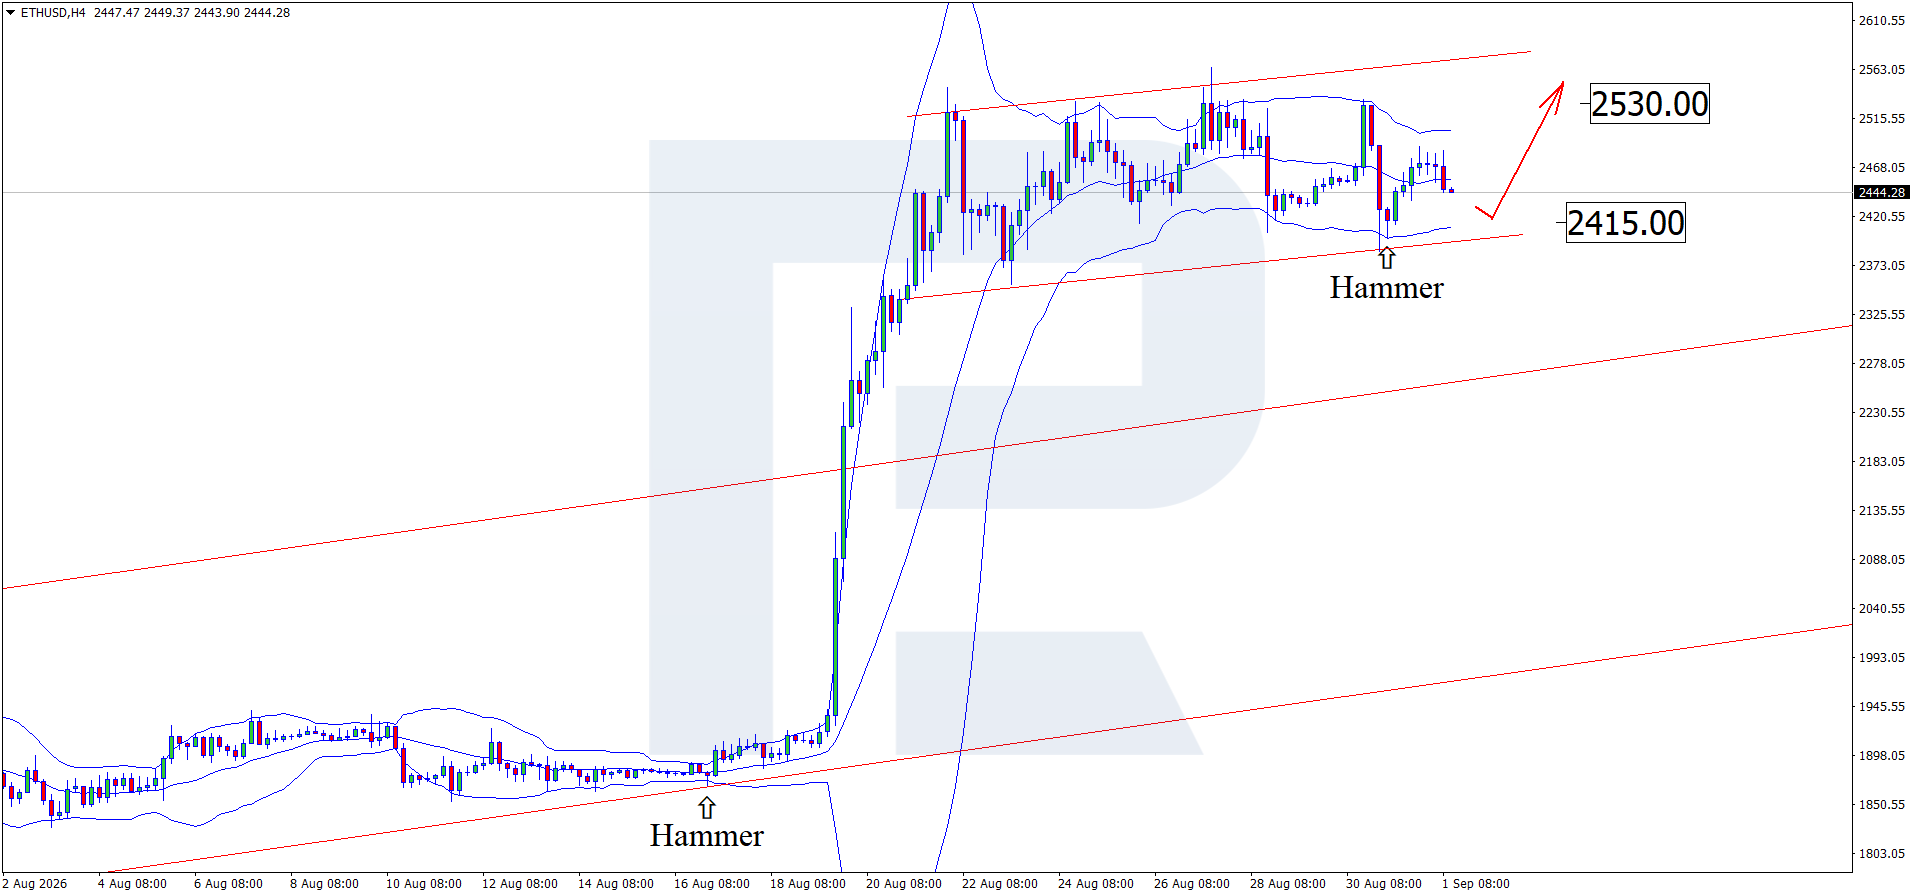
Ethereum trading scenarios for today
Main scenario (Buy Stop)
A breakout above the resistance level, followed by consolidation above 2,530.00, would create conditions for opening long positions.
- Current price: 2,444.00
- Entry price: 2,530.00
- Stop loss: 2,500.00
- Take profit: 2,665.00
- Risk-to-reward ratio: more than 1:4
Alternative scenario (Sell Stop)
A breakout and consolidation below the 2,415.00 support level would signal the end of the bullish momentum and a continued correction.
- Entry price: 2,415.00
- Stop loss: 2,440.00
- Take profit: 2,350.00
- Risk-to-reward ratio: more than 1:2
The trade idea is valid until midnight on 4 September 2026 (server time, UTC+3).
Risk factors
The main risk to further ETHUSD growth remains buyers’ failure to overcome the 2,530.00 USD resistance level, which could lead to a prolonged correction. If sellers regain control and consolidate below 2,415.00 USD, this would signal the end of the bullish momentum.
Summary
Inflows into spot ETFs are providing additional support for ETHUSD, but the price continues to correct. Today’s ETHUSD technical analysis suggests a rise towards 2,530.00 after the correction is complete.
Editors’ picks

EURUSD forecast 2026–2027: technical analysis, price levels & predictions
EURUSD has recovered from the July lows and is trading near 1.1545 — back in bullish territory. The pair has reclaimed EMA65 on the daily, formed a bullish EMA crossover on H4, and the US-eurozone GDP gap has narrowed sharply (US 1.5% vs eurozone 1.0%). Goldman Sachs and Deutsche Bank both now target 1.2500 by year-end. A confirmed close above 1.1700 opens the path to 1.1805. We break down the key levels, three trading scenarios, and what the unprecedented 9-3 FOMC dissent vote means for EURUSD.

Gold (XAUUSD) forecast 2026: technical analysis, price levels & predictions
Gold has reversed its downtrend and is trading near 4,360 USD, back above both EMA65 and EMA200. ETF flows turned positive in July with 3 billion USD of net inflows, and central banks bought 288.9 tonnes in Q2 — up 62% year-on-year. A breakout above 4,500 USD opens the path to 4,855 USD and the 5,597 USD all-time high. We break down the key levels, three trading scenarios with entry triggers, and what J.P. Morgan, Deutsche Bank and Goldman Sachs are forecasting for gold in 2026.
Ang mga pagtataya na ipinakita sa seksyong ito ay nagpapakita lamang ng pribadong opinyon ng may-akda at hindi dapat ituring bilang gabay para sa pagtetrade. Walang pananagutan ang RoboForex para sa mga resulta ng pagtetrade batay sa mga rekomendasyon sa pagtetrade na inilarawan sa mga analytical review na ito.