Solana is on the verge of a major shake-up
SOLUSD continues its upward trajectory today after a correction, with the price currently at 77.75. Discover more in our analysis for 2 July 2026.
SOLUSD forecast: key takeaways
- Over the past week, the Solana network has processed nearly a billion transactions
- Around 600,000 SOL were suddenly transferred to centralised exchanges over the last 72 hours
- SOLUSD forecast for 2 July 2026: 75.50 and 83.00
Fundamental analysis
Today’s Solana price forecast takes into account that Solana is showing notable growth amid the broader market recovery.
Over the past week, the Solana network processed nearly a billion transactions, confirming the network’s high real-world utility. In addition, Solana-based applications generated more than 250 million USD in Q2, making it the highest-performing network in terms of fees among all layer-1 and layer-2 blockchains for the ninth consecutive quarter.
Total assets under management in spot Solana ETFs exceeded 1 billion USD, providing a steady inflow of liquidity. There are also unconfirmed market rumours that a major market maker is preparing to build reserves to support a spot SOL ETF, which is also adding optimism.
Despite the positive trend, several serious risks remain: a major SOL token unlock is scheduled for July 2026, and sales from the bankrupt FTX exchange also remain possible. Activity by large players is another concern, as around 600,000 SOL were suddenly transferred to centralised exchanges over the last 72 hours, which may indicate that large holders are preparing to sell. Over 72% of Binance accounts hold long positions in SOL. Such a high concentration makes the asset highly vulnerable to cascading liquidations if the price falls sharply.
The positive SOLUSD forecast for 2 July 2026 is driven by the network’s strong fundamentals and improving market sentiment, but investors should remain cautious due to the high risk of a correction.
Technical outlook
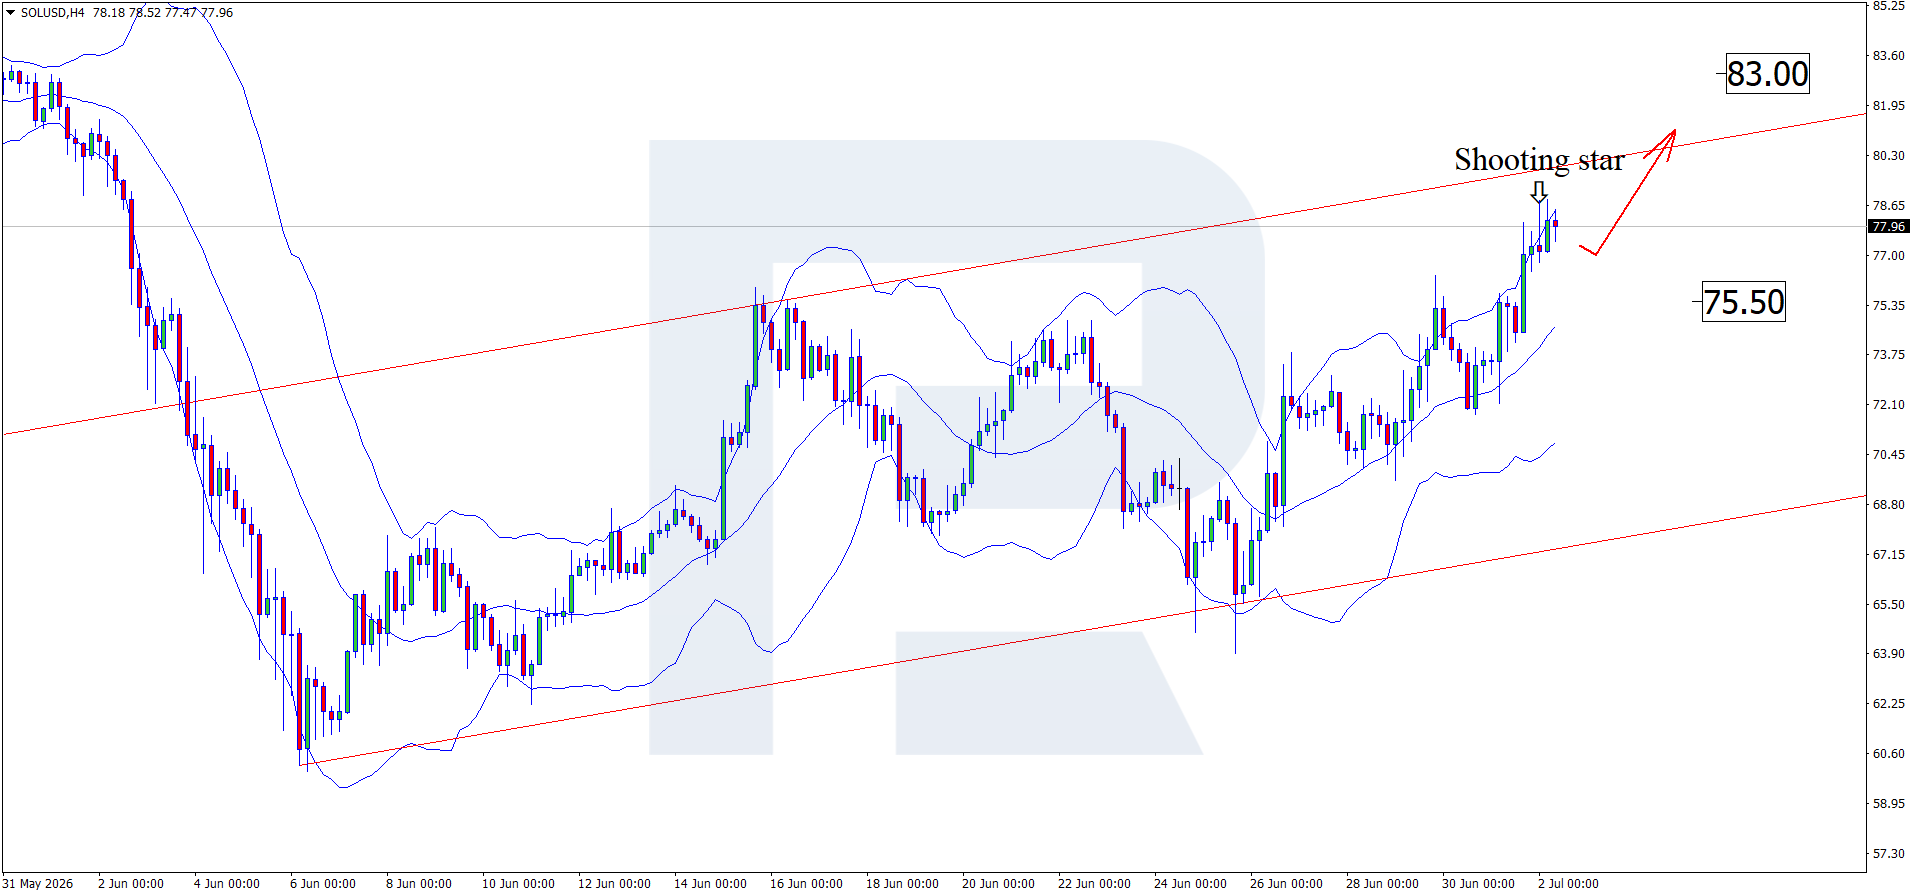
On the H4 chart, SOLUSD formed a Shooting Star reversal pattern near the upper Bollinger Band. At this stage, quotes may form a corrective wave following this signal, with the pullback target at the 75.50 support level. A rebound from this level will open the way for continued upward movement.
At the same time, today’s technical analysis of SOLUSD also suggests another scenario. The price could continue to rise and test the 83.00 resistance level. After breaking it, it may maintain its upward momentum.
SOLUSD overview
- Asset: SOLUSD
- Timeframe: H4 (Intraday)
- Trend: upward
- Key resistance levels: 78.87 and 83.00
- Key support levels: 75.50 and 64.05
Solana trading scenarios for today
Main scenario (Buy Stop)
A breakout and consolidation above the 78.87 resistance level would indicate increased buying pressure and create conditions for opening long positions.
- Take Profit: 83.00
- Stop Loss: 78.00
Alternative scenario (Sell Stop)
A breakout below the support level, followed by consolidation below 75.50, would indicate a bearish correction.
- Take Profit: 64.05
- Stop Loss: 76.00
Risk factors
The upside scenario for Solana may fail to materialise if selling pressure intensifies and the price consolidates below the 75.50 support level. An additional risk to the bullish scenario comes from weakness in the cryptocurrency market and a stronger USD.
Summary
Large players continue to support Solana, thereby driving further growth. Today’s technical analysis of SOLUSD suggests a correction towards the 75.50 support level before growth resumes.
Editors’ picks

EURUSD forecast 2026–2027: technical analysis, price levels & predictions
The ECB holds rates at 2.15% while the Fed stays at 3.75% — and that divergence is the central driver of EURUSD in 2026. The pair is range-bound between 1.1400 and 1.1915, with Deutsche Bank targeting 1.2500 and Morgan Stanley calling for 1.3000 by year-end. We analyse the technicals, break down the macro factors, and outline three trading scenarios with specific entry levels.

Gold (XAUUSD) forecast 2026: predictions based on fundamental and technical analysis
Where is gold headed after pulling back from the all-time high of 5,597 USD? XAUUSD is consolidating near 4,518 USD between key levels 4,220 USD and 4,855 USD, with major banks targeting 5,243–6,200 USD by year-end. Read our comprehensive gold forecast: technical analysis across three timeframes, trading scenarios with specific entry levels, Fed policy and central bank demand outlook, and institutional predictions for 2026 and beyond.
Ang mga pagtataya na ipinakita sa seksyong ito ay nagpapakita lamang ng pribadong opinyon ng may-akda at hindi dapat ituring bilang gabay para sa pagtetrade. Walang pananagutan ang RoboForex para sa mga resulta ng pagtetrade batay sa mga rekomendasyon sa pagtetrade na inilarawan sa mga analytical review na ito.