
Solana shows strong fundamentals, but bears remain in control
SOLUSD remains under selling pressure despite a strong fundamental backdrop and growing institutional investor interest in the Solana ecosystem. The price currently stands at 78.03. Find out more in our analysis for 9 July 2026
SOLUSD forecast: key takeaways
- The volume of tokenised real-world assets in the Solana network increased by 540 million USD over the week, reaching a new all-time high
- The introduction of European regulation accelerated the redistribution of capital from high-risk altcoins into more stable blockchain platforms
- SOLUSD forecast for 9 July 2026: 64.80
Fundamental analysis
The SOLUSD price is correcting upwards after declining for two consecutive trading sessions. Near the 75.85 USD mark, sellers encountered strong support, allowing buyers to seize the initiative temporarily.
The fundamental backdrop remains favourable for Solana. The volume of tokenised real-world assets in the network increased by 540 million USD over the last week, reaching a new all-time high of 3.62 billion USD. Corporate credit instruments and tokenised equity indices contributed most to the increase. This trend indicates sustained interest from institutional investors, who are attracted by Solana’s low fees and high network throughput.
Changes in European regulation are also providing additional support. The entry into force of MiCA requirements intensified capital outflows from less reliable altcoins, as institutional investors became more selective in choosing digital assets. As a result, a significant share of funds is being redistributed into the largest blockchain platforms, such as Ethereum and Solana, which offer high liquidity, a developed ecosystem, and clearer regulatory prospects.
Despite the strong fundamental backdrop, the technical picture remains cautious. SOLUSD is still trading within a descending channel, maintaining the risk of a renewed decline. A confident breakout below the 75.85 USD support level could signal a new downward wave and stronger selling pressure.
Technical outlook
The Solana price is rebounding from the support level, but it continues to trade within the medium-term descending channel, indicating that sellers have the upper hand. Today’s forecast for SOLUSD suggests a new downward wave, with the nearest target at 64.80 USD.
The technical picture suggests that a bearish scenario is highly likely. The Stochastic Oscillator turned downwards after leaving oversold territory, confirming weakening upward momentum. A breakout below the lower boundary of the local ascending channel, followed by price consolidation below 76.55 USD, would further signal a renewed decline, confirming the completion of the current corrective phase.
An alternative scenario suggests stronger buyer activity. If quotes break above the upper boundary of the medium-term descending channel and consolidate above the 82.75 USD resistance level, this would confirm the end of the downtrend and open the potential for a sustainable upward move.
SOLUSD overview
- Asset: SOLUSD
- Timeframe: H4 (Intraday)
- Trend: upward
- Key resistance levels: 78.05 and 82.05
- Key support levels: 69.05 and 64.8
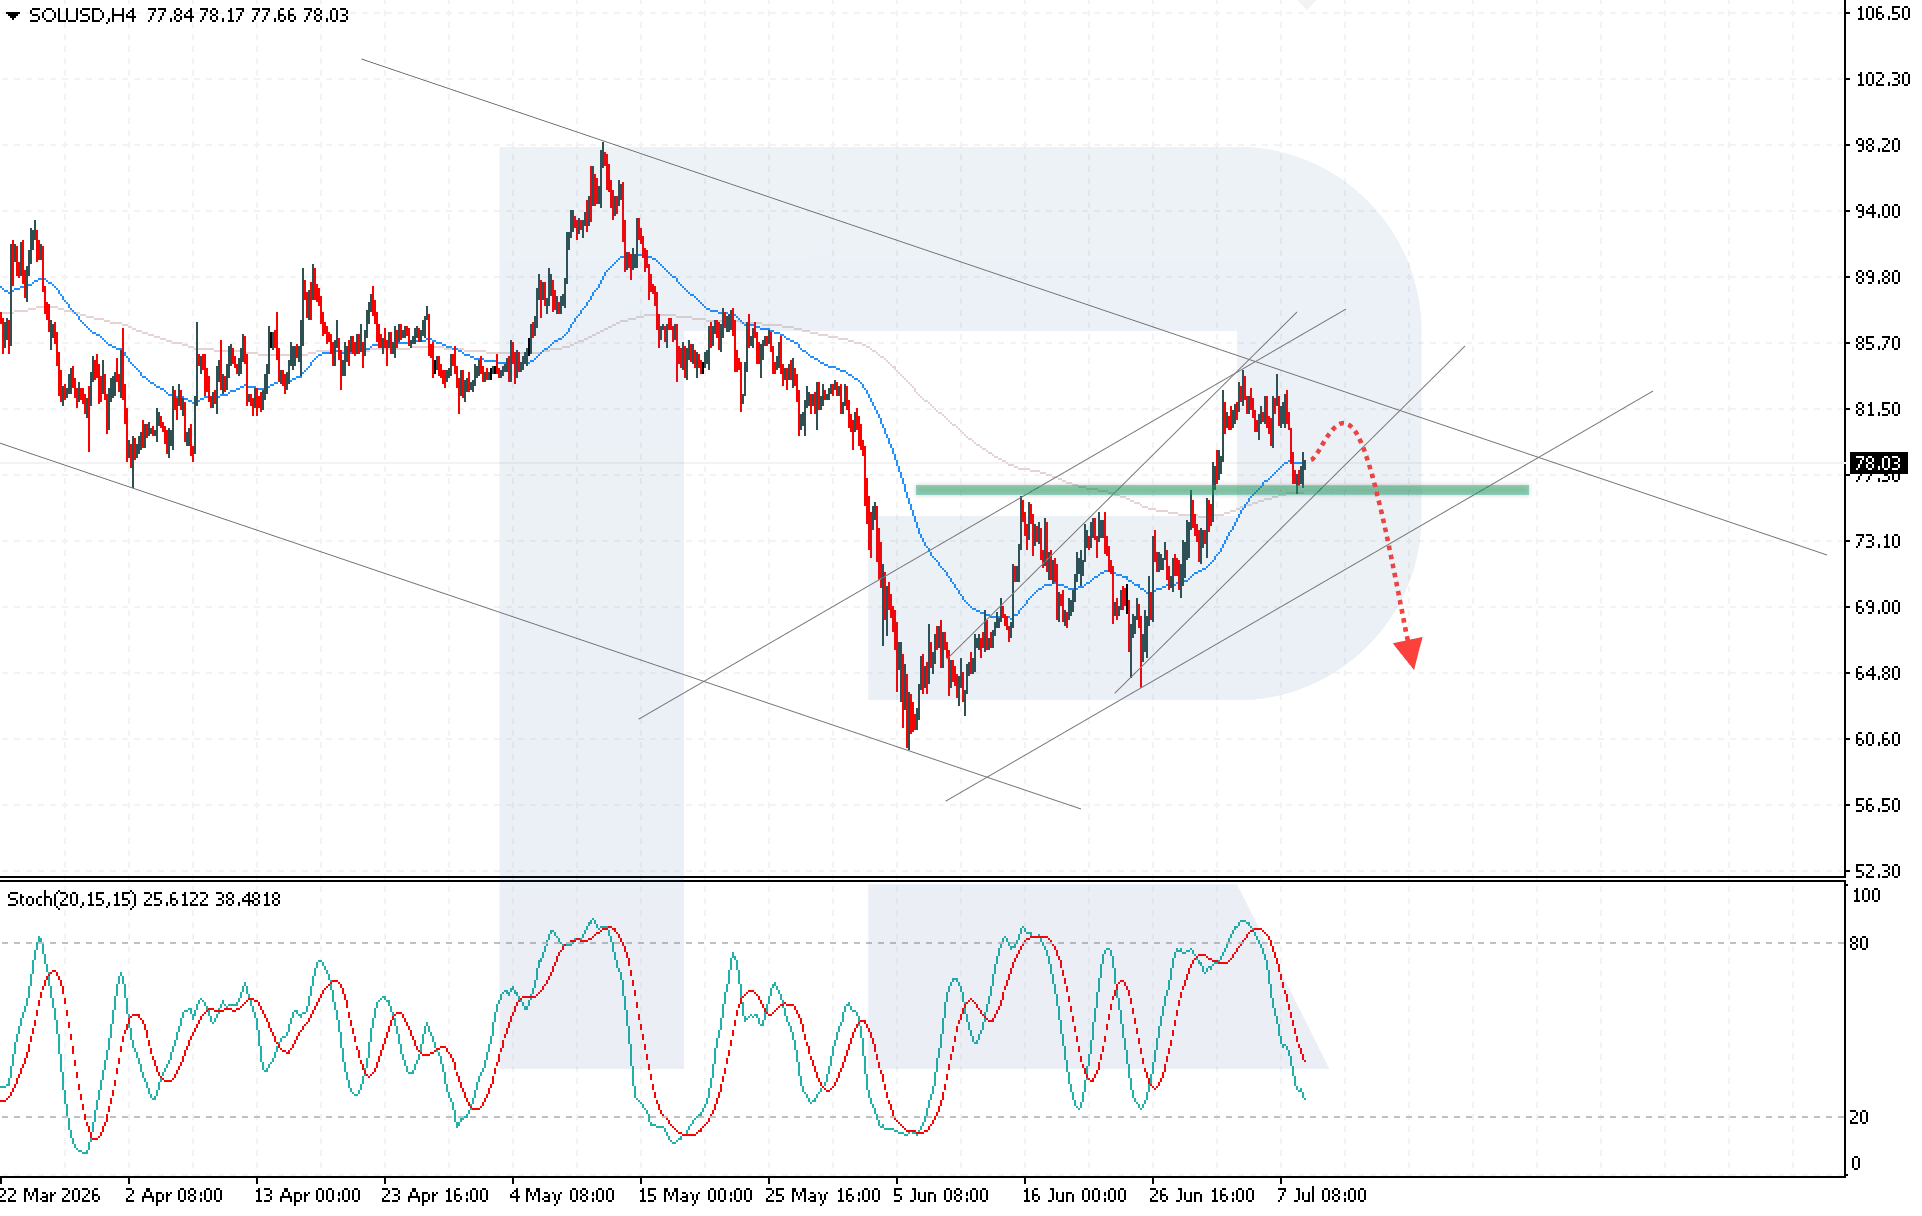
Solana trading scenarios for today
Main scenario (Sell Stop)
A breakout below the lower boundary of the bullish corrective channel, with the price consolidating below 78.05, would indicate the completion of the upward correction and stronger bearish pressure.
- Take Profit: 64.80
- Stop Loss: 79.55
Alternative scenario (Buy Stop)
A breakout above the upper boundary of the medium-term descending channel, followed by consolidation above 82.75, would indicate continued upward movement in SOLUSD.
- Take Profit: 94.05
- Stop Loss: 76.20
Risk factors
The main risk to the SOLUSD downside scenario remains stronger buyer activity amid institutional capital inflows and growing interest in the Solana ecosystem. Consolidation above the 82.75 USD resistance level may cancel the bearish scenario and open the way for growth.
Summary
Despite strong fundamental support from institutional demand and ecosystem growth, the price remaining within a descending channel indicates a bearish outlook for Solana and the prevailing downside risks in the short term.
Editors’ picks

EURUSD forecast 2026–2027: technical analysis, price levels & predictions
The ECB holds rates at 2.15% while the Fed stays at 3.75% — and that divergence is the central driver of EURUSD in 2026. The pair is range-bound between 1.1400 and 1.1915, with Deutsche Bank targeting 1.2500 and Morgan Stanley calling for 1.3000 by year-end. We analyse the technicals, break down the macro factors, and outline three trading scenarios with specific entry levels.

Gold (XAUUSD) forecast 2026: predictions based on fundamental and technical analysis
Where is gold headed after pulling back from the all-time high of 5,597 USD? XAUUSD is consolidating near 4,518 USD between key levels 4,220 USD and 4,855 USD, with major banks targeting 5,243–6,200 USD by year-end. Read our comprehensive gold forecast: technical analysis across three timeframes, trading scenarios with specific entry levels, Fed policy and central bank demand outlook, and institutional predictions for 2026 and beyond.
Ang mga pagtataya na ipinakita sa seksyong ito ay nagpapakita lamang ng pribadong opinyon ng may-akda at hindi dapat ituring bilang gabay para sa pagtetrade. Walang pananagutan ang RoboForex para sa mga resulta ng pagtetrade batay sa mga rekomendasyon sa pagtetrade na inilarawan sa mga analytical review na ito.