
SOLUSD rises on institutional interest
SOLUSD is showing aggressive growth, strengthening confidently despite broader investor caution. The price currently stands at 103.34. For more details, see our analysis for 27 August 2026.
SOLUSD forecast: key takeaways
- Capital is rotating in the cryptocurrency market from heavyweight BTCUSD and ETHUSD funds into the more dynamic SOLUSD
- Total net inflows into spot Solana ETFs since their launch have exceeded 1.22 billion USD
- SOLUSD forecast for 27 August 2026: 117.05
Fundamental analysis
SOLUSD is showing aggressive growth today, with buyers attempting to consolidate above the local resistance level of 102.75 USD. The asset is strengthening confidently despite broader investor caution ahead of Federal Reserve Chairman Kevin Warsh’s speech at the Jackson Hole Economic Symposium. Comments from the US central bank leadership will be the key factor shaping the future medium-term trend across risk assets.
Against this backdrop, institutional interest in Solana in the US has entered an aggressive phase. Total net inflows into US spot Solana ETFs since their launch have exceeded the historic 1.22 billion USD mark, with inflows recorded for five consecutive days. Monday became the strongest day of 2026, with a one-day inflow of 33.5 million USD. This reflects a steady rotation of capital from heavyweight BTCUSD and ETHUSD funds into the more dynamic SOLUSD.
The main internal driver for Solana remains the ongoing boom in the real-world asset tokenisation (RWA) sector, whose total value on the network has already exceeded a record 4.2 billion USD. The coin is also receiving additional support from the entry into force of the European MiCA regulation, which is prompting large regulated EU funds to reallocate capital away from questionable altcoins towards industry leaders.
Technical outlook
SOLUSD price is attempting to consolidate above the upper boundary of the Triangle pattern. If the pattern boundary is broken confidently, today’s SOLUSD forecast suggests an upward wave with the nearest target at 117.05 USD.
The technical picture indicates a high probability of the bullish scenario, with the price holding near the EMA-65. The Stochastic Oscillator has reached overbought territory, which may point to a minor correction before further growth. An additional signal in favour of an advance would be a rebound from the upper boundary of the Triangle pattern.
An alternative scenario suggests increasing bearish pressure. If the price breaks below the lower boundary of the bullish channel and consolidates below 100.05 USD, this would confirm the end of the bullish trend impulse and open the way for a correction in SOLUSD.
SOLUSD overview
- Asset: SOLUSD
- Timeframe: M30 (intraday)
- Trend: bullish
- Key resistance levels: 106.75 and 118.90
- Key support levels: 102.75 and 95.50
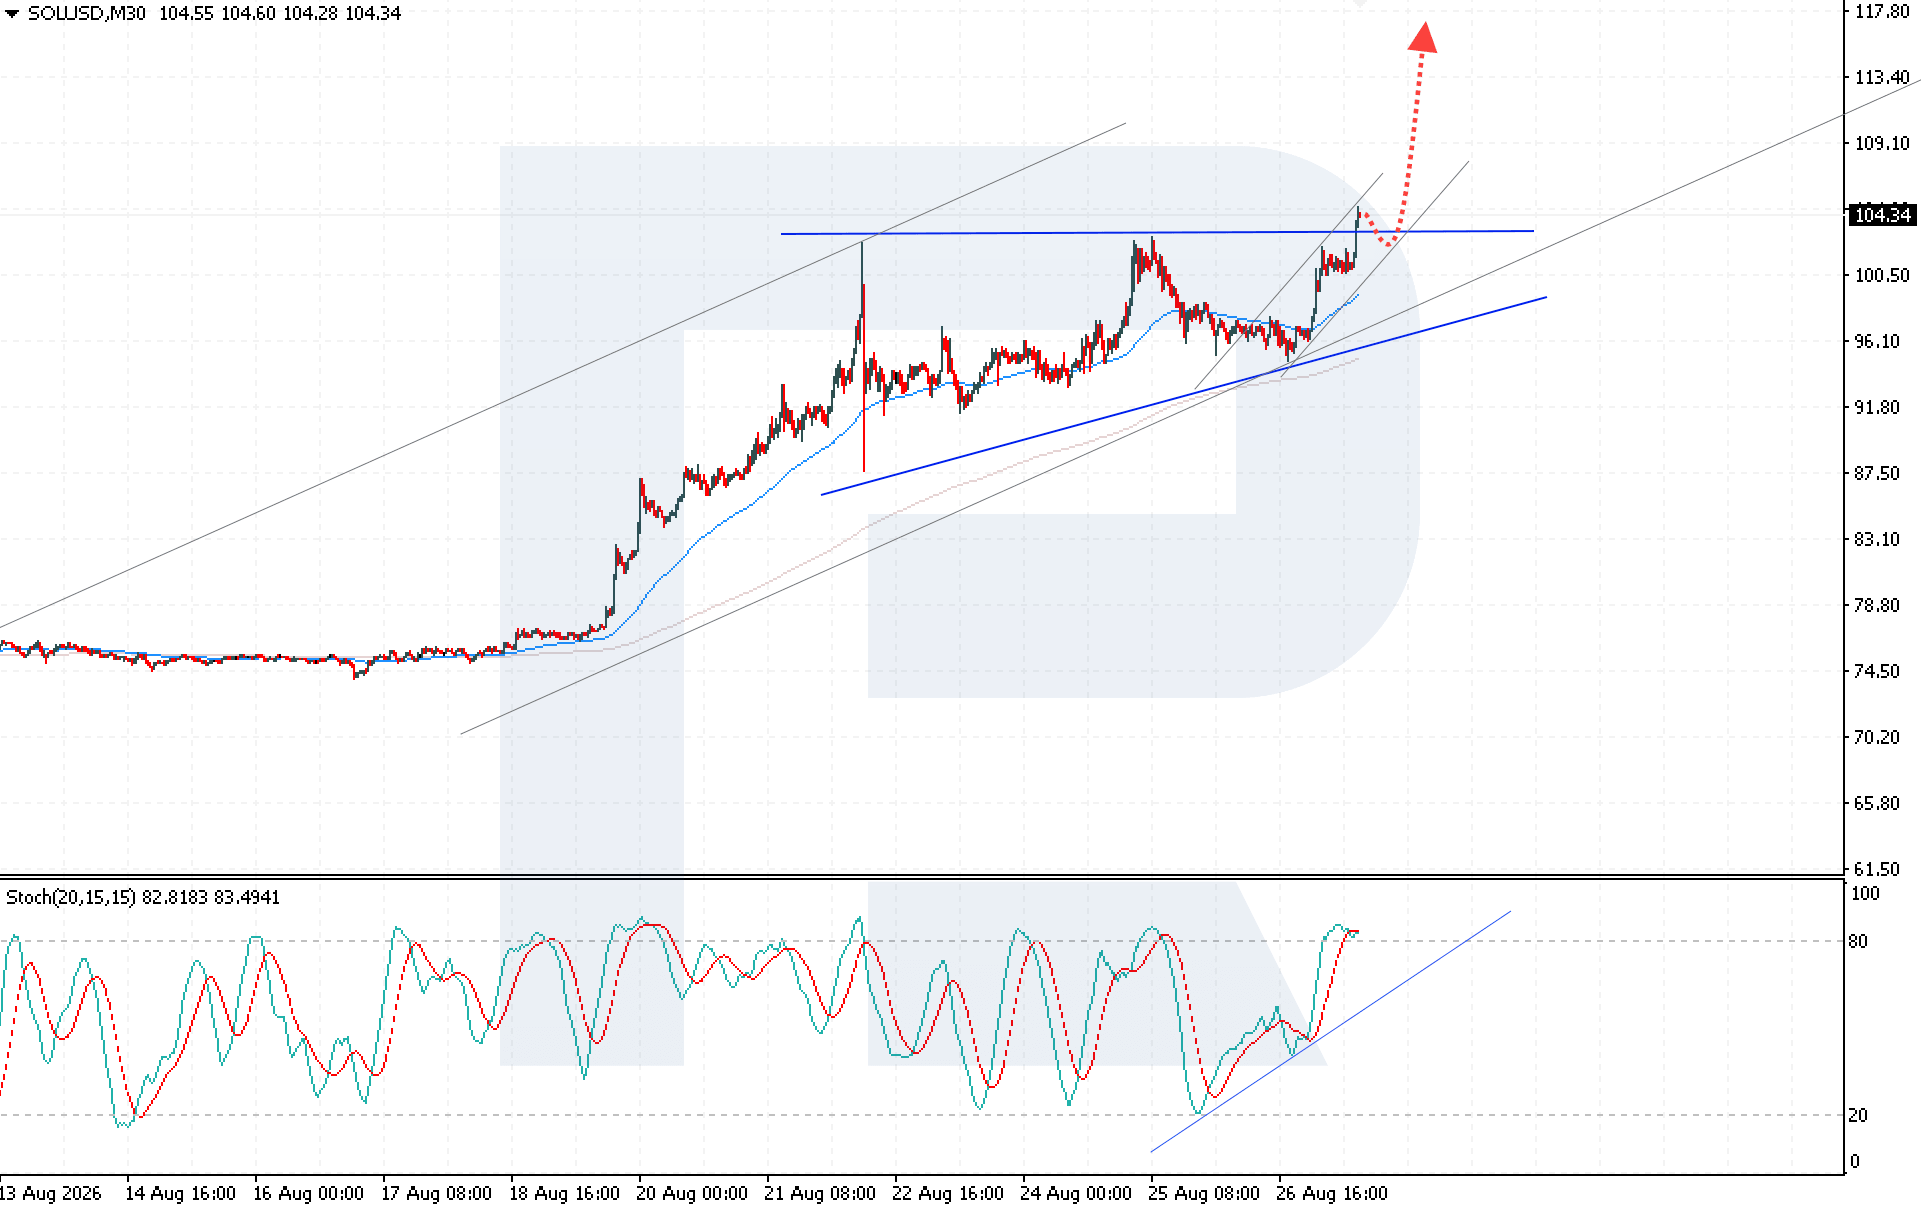
Solana trading scenarios for today
Main scenario (Buy Stop)
Consolidation above the upper boundary of the Triangle pattern indicates a high probability of the pattern playing out, with a target at 117.05 USD.
- Current price: 104.34
- Entry level: 105.05
- Take profit: 117.05
- Stop loss: 101.05
- Risk-to-reward ratio: 1:3
Alternative scenario (Sell Stop)
A breakout below the lower boundary of the bullish channel, with prices consolidating below 100.05, would indicate increased bearish pressure and a continued decline.
- Entry level: 99.65
- Take profit: 90.05
- Stop loss: 103.55
- Risk-to-reward ratio: more than 1:2
The trade idea is valid until midnight on 30 August 2026 (server time, UTC+3).
Risk factors
The main risk to the bullish SOLUSD scenario is aggressive hawkish rhetoric from Kevin Warsh at the Jackson Hole Symposium. In this case, a sharp strengthening of the US dollar could trigger a large-scale wave of profit-taking across risk assets.
Summary
The current rally in SOLUSD, driven by substantial institutional capital inflows into spot ETFs, confirms the asset’s strong underlying fundamentals, allowing it to withstand a temporary broader market lull.
Editors’ picks

EURUSD forecast 2026–2027: technical analysis, price levels & predictions
EURUSD has recovered from the July lows and is trading near 1.1545 — back in bullish territory. The pair has reclaimed EMA65 on the daily, formed a bullish EMA crossover on H4, and the US-eurozone GDP gap has narrowed sharply (US 1.5% vs eurozone 1.0%). Goldman Sachs and Deutsche Bank both now target 1.2500 by year-end. A confirmed close above 1.1700 opens the path to 1.1805. We break down the key levels, three trading scenarios, and what the unprecedented 9-3 FOMC dissent vote means for EURUSD.

Gold (XAUUSD) forecast 2026: technical analysis, price levels & predictions
Gold has reversed its downtrend and is trading near 4,360 USD, back above both EMA65 and EMA200. ETF flows turned positive in July with 3 billion USD of net inflows, and central banks bought 288.9 tonnes in Q2 — up 62% year-on-year. A breakout above 4,500 USD opens the path to 4,855 USD and the 5,597 USD all-time high. We break down the key levels, three trading scenarios with entry triggers, and what J.P. Morgan, Deutsche Bank and Goldman Sachs are forecasting for gold in 2026.
Ang mga pagtataya na ipinakita sa seksyong ito ay nagpapakita lamang ng pribadong opinyon ng may-akda at hindi dapat ituring bilang gabay para sa pagtetrade. Walang pananagutan ang RoboForex para sa mga resulta ng pagtetrade batay sa mga rekomendasyon sa pagtetrade na inilarawan sa mga analytical review na ito.