
SOLUSD buyers prepare for a breakout above the upper boundary of the Wedge pattern
SOLUSD is rising for a second consecutive trading session, offsetting the negative impact of the Federal Reserve's rate hike. The current price is 100.58. Find out more in our analysis for 17 September 2026.
SOLUSD forecast: key takeaways
- The US Federal Reserve raised interest rates by 25 basis points
- The Federal Reserve noted that US inflation remains elevated while economic activity remains resilient
- SOLUSD forecast for 17 September 2026: 113.90
Fundamental analysis
SOLUSD is rising for a second consecutive trading session. Buyers decisively broke above the 99.50 resistance level. The failure to advance the CLARITY Act dealt a significant blow to market sentiment. On 15 September, the US Senate failed to secure the 60 votes required to advance the bill, with the procedural vote ending 49–50. The decision was a major regulatory disappointment for the cryptocurrency market and increased pressure on major altcoins, including Solana.
Macroeconomic factors compounded the regulatory disappointment. On 16 September, the US Federal Reserve unanimously raised interest rates by 25 basis points to 3.75–4.00% per annum. In its accompanying statement, the regulator noted that inflation remains elevated while economic activity remains resilient. The Federal Reserve's hawkish stance intensified pressure on risk assets and triggered a local decline in SOL and other major altcoins.
At the same time, corporate demand for Solana remains resilient. DeFi Development Corp. increased its reserves by approximately 2% to 2.39 million SOL and equivalents, adding 55,491 tokens since the end of August. The company also launched a programme to sell CHAD preferred shares worth up to 300 million USD, with the proceeds intended, among other things, to further increase its Solana holdings.
Technical outlook
SOLUSD is testing the EMA-65 line, while the risk of a Wedge reversal pattern forming remains. Today's SOLUSD price forecast suggests a continuation of the upward move towards the 113.90 target.
The technical picture continues to show signs of a developing bullish scenario. The Stochastic Oscillator is rebounding from the support line and generating a signal in favour of buyers, indicating the potential for stronger bullish momentum. An additional signal in favour of buyers would be a breakout above the upper boundary of the Wedge reversal pattern, followed by consolidation above 102.55. In this case, buying pressure could strengthen, opening the way for further gains.
The alternative scenario would become relevant if the price breaks below the lower boundary of the bullish channel and consolidates below 97.55. This would signal weakening buyer pressure and could create conditions for a downward correction.
SOLUSD overview
- Asset: SOLUSD
- Timeframe: H4 (Intraday)
- Trend: bullish
- Key resistance levels: 102.55 and 105.00
- Key support levels: 99.50 and 97.55
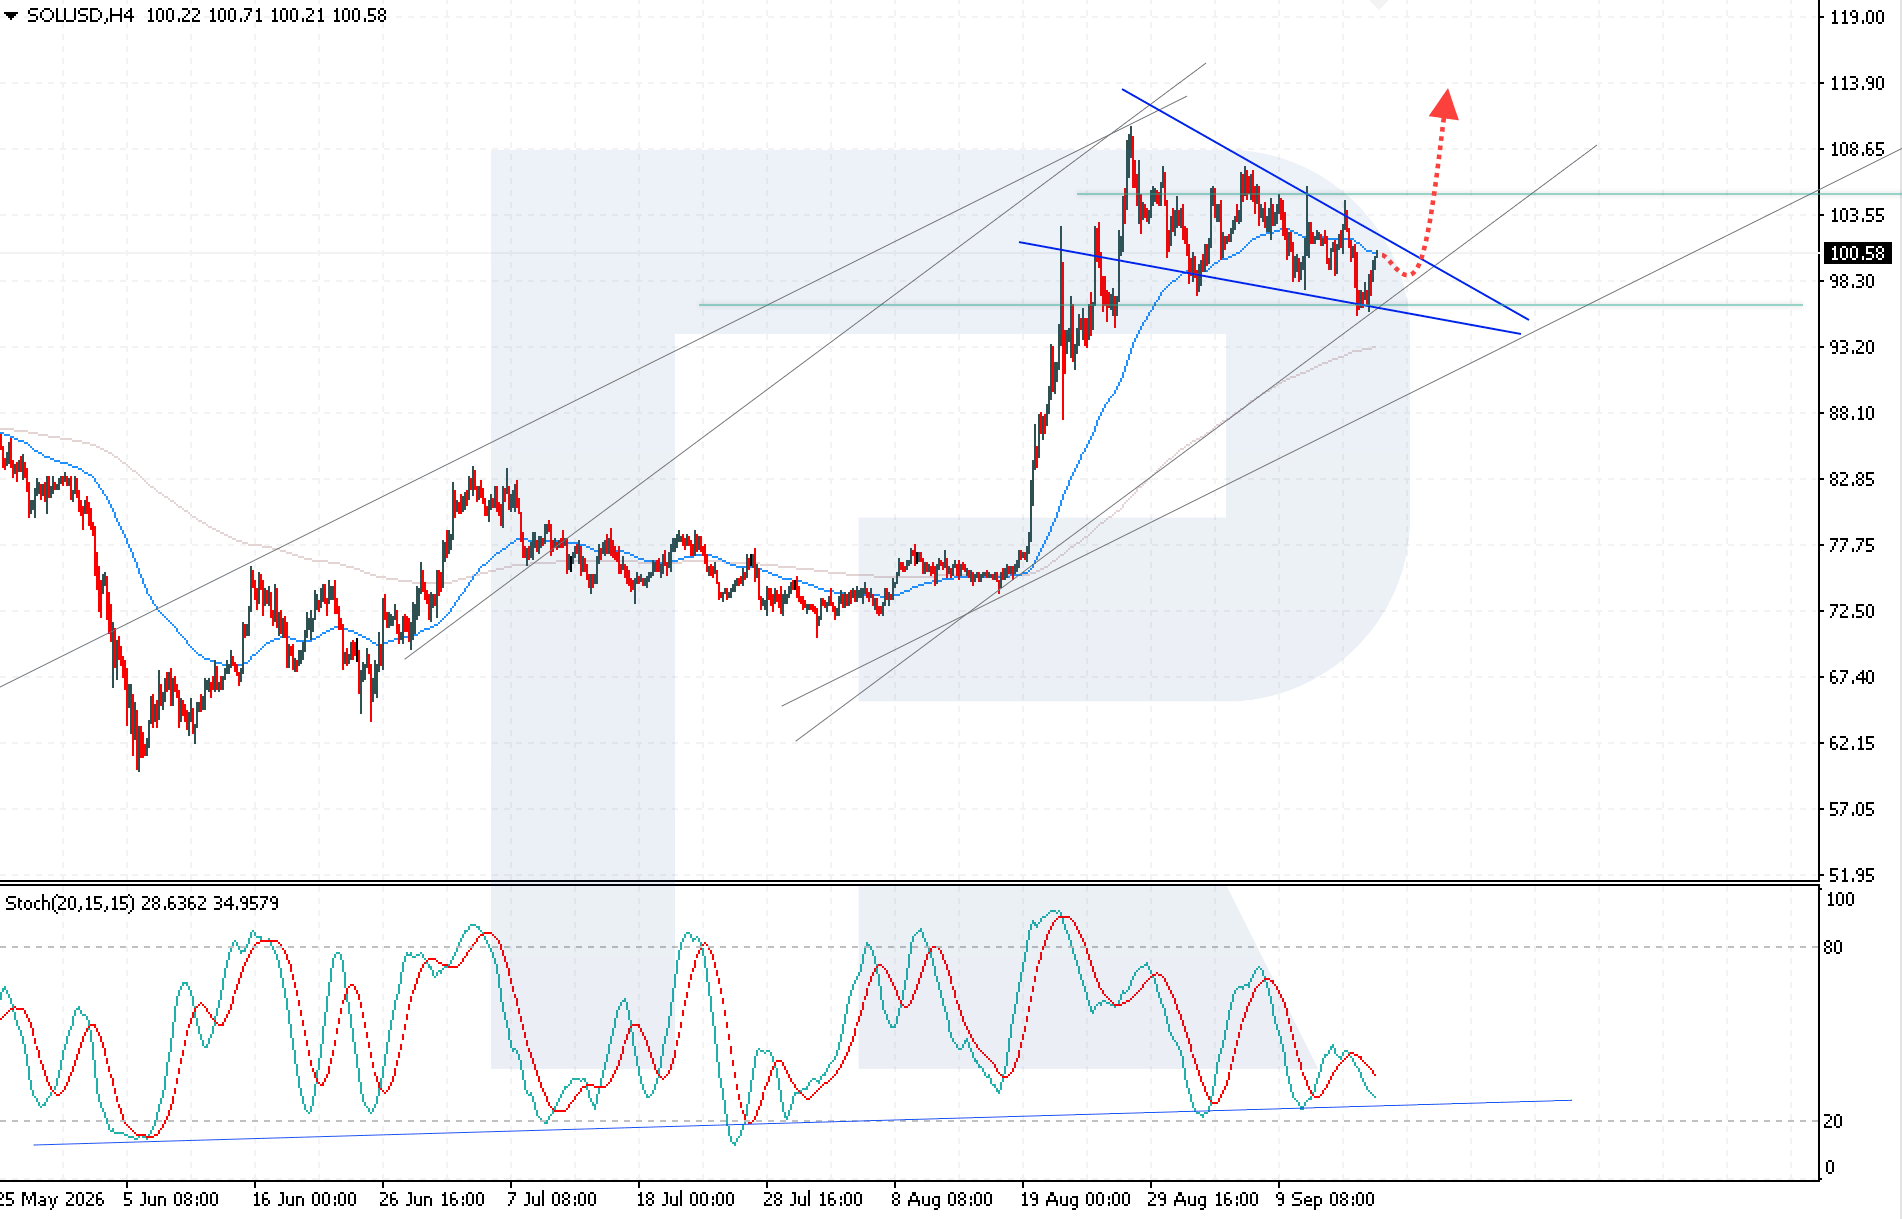
Solana trading scenario for today
Trading scenario (Buy Stop)
A breakout above the upper boundary of the Wedge reversal pattern, followed by consolidation above 102.55, would indicate stronger bullish pressure and create conditions for opening long positions with a target at 113.90.
- Current price: 100.58
- Entry level: 102.55
- Stop Loss: 98.45
- Take Profit: 113.90
- Risk-to-reward ratio: above 1:2
The trade idea is valid until 08:00 AM on 20 September 2026 (server time, UTC+3).
Risk factors
The main risk to the bullish SOLUSD scenario remains the formation of a Wedge reversal pattern and buyers' inability to consolidate above 102.55. An additional negative signal would be a break below the EMA-65 line and a decline below 97.55, which could intensify selling pressure.
Summary
The current rise in SOLUSD is driven by resilient corporate demand, which has allowed Solana buyers to regain the initiative and offset broad market pressure.
Editors’ picks

EURUSD forecast 2026–2027: technical analysis, price levels & predictions
EURUSD has recovered from the July lows and is trading near 1.1545 — back in bullish territory. The pair has reclaimed EMA65 on the daily, formed a bullish EMA crossover on H4, and the US-eurozone GDP gap has narrowed sharply (US 1.5% vs eurozone 1.0%). Goldman Sachs and Deutsche Bank both now target 1.2500 by year-end. A confirmed close above 1.1700 opens the path to 1.1805. We break down the key levels, three trading scenarios, and what the unprecedented 9-3 FOMC dissent vote means for EURUSD.

Gold (XAUUSD) forecast 2026: technical analysis, price levels & predictions
Gold has reversed its downtrend and is trading near 4,360 USD, back above both EMA65 and EMA200. ETF flows turned positive in July with 3 billion USD of net inflows, and central banks bought 288.9 tonnes in Q2 — up 62% year-on-year. A breakout above 4,500 USD opens the path to 4,855 USD and the 5,597 USD all-time high. We break down the key levels, three trading scenarios with entry triggers, and what J.P. Morgan, Deutsche Bank and Goldman Sachs are forecasting for gold in 2026.
Ang mga pagtataya na ipinakita sa seksyong ito ay nagpapakita lamang ng pribadong opinyon ng may-akda at hindi dapat ituring bilang gabay para sa pagtetrade. Walang pananagutan ang RoboForex para sa mga resulta ng pagtetrade batay sa mga rekomendasyon sa pagtetrade na inilarawan sa mga analytical review na ito.