
XRPUSD risks further decline as bearish momentum strengthens
The XRPUSD price remains under selling pressure after reversing from key resistance levels. The current quote is 1.0628. For more details, see our analysis for 5 August 2026.
XRPUSD forecast: key takeaways
- Senator Elizabeth Warren stepped up criticism of the Clarity Act
- Uncertainty surrounding cryptocurrency regulation in the US persists
- S&P Dow Jones Indices removed XRP from its updated institutional cryptocurrency index
- XRPUSD forecast for 5 August 2026: 1.0045
Fundamental analysis
The XRPUSD price is declining for the second consecutive trading session after sellers held the key resistance level at 1.0865. The nearest significant support level is located at 1.0515. A breakout below this mark could increase selling pressure and confirm continued bearish momentum.
An additional pressure factor was Ripple’s scheduled release of 1 billion XRP tokens from escrow accounts on 1 August. However, to minimise the potential market impact, the company immediately locked 700 million XRP back into escrow. As a result, only 300 million tokens entered free circulation, limiting the potential increase in supply.
Market sentiment also deteriorated amid stronger criticism from Senator Elizabeth Warren of the Clarity Act, which is intended to define the final legal status of payment tokens. Resistance in Congress reduces the likelihood of its swift adoption, maintaining regulatory uncertainty and potentially constraining institutional capital inflows into cryptocurrency ETFs.
Another negative signal was the exclusion of XRP from the updated institutional cryptocurrency index by S&P Dow Jones Indices. The decision was linked to the XRP Ledger’s low revenue from network fees, raising new questions about the asset’s fundamental appeal to large investors.
Technical outlook
XRPUSD quotes are declining after rebounding from the upper boundary of the Triangle pattern. Price action analysis indicates that sellers remain in control. Today’s XRPUSD forecast suggests a decline towards 1.0045.
The technical picture remains favourable for the downside scenario. The Stochastic Oscillator turned downwards after rebounding from the resistance line, signalling stronger bearish momentum. A breakout below the lower boundary of the Triangle pattern, followed by consolidation below 1.0505, would further confirm a continued XRPUSD decline, indicating the end of the corrective phase and a renewed downward movement.
An alternative scenario suggests increased buying pressure. If the price rises above the local resistance level and consolidates above 1.0905, this would signal the start of a bullish scenario with potential targets above current levels.
XRPUSD overview
- Asset: XRPUSD
- Timeframe: H1 (intraday)
- Trend: bearish
- Key resistance levels: 1.0865 and 1.1120
- Key support levels: 1.060 and 1.0250
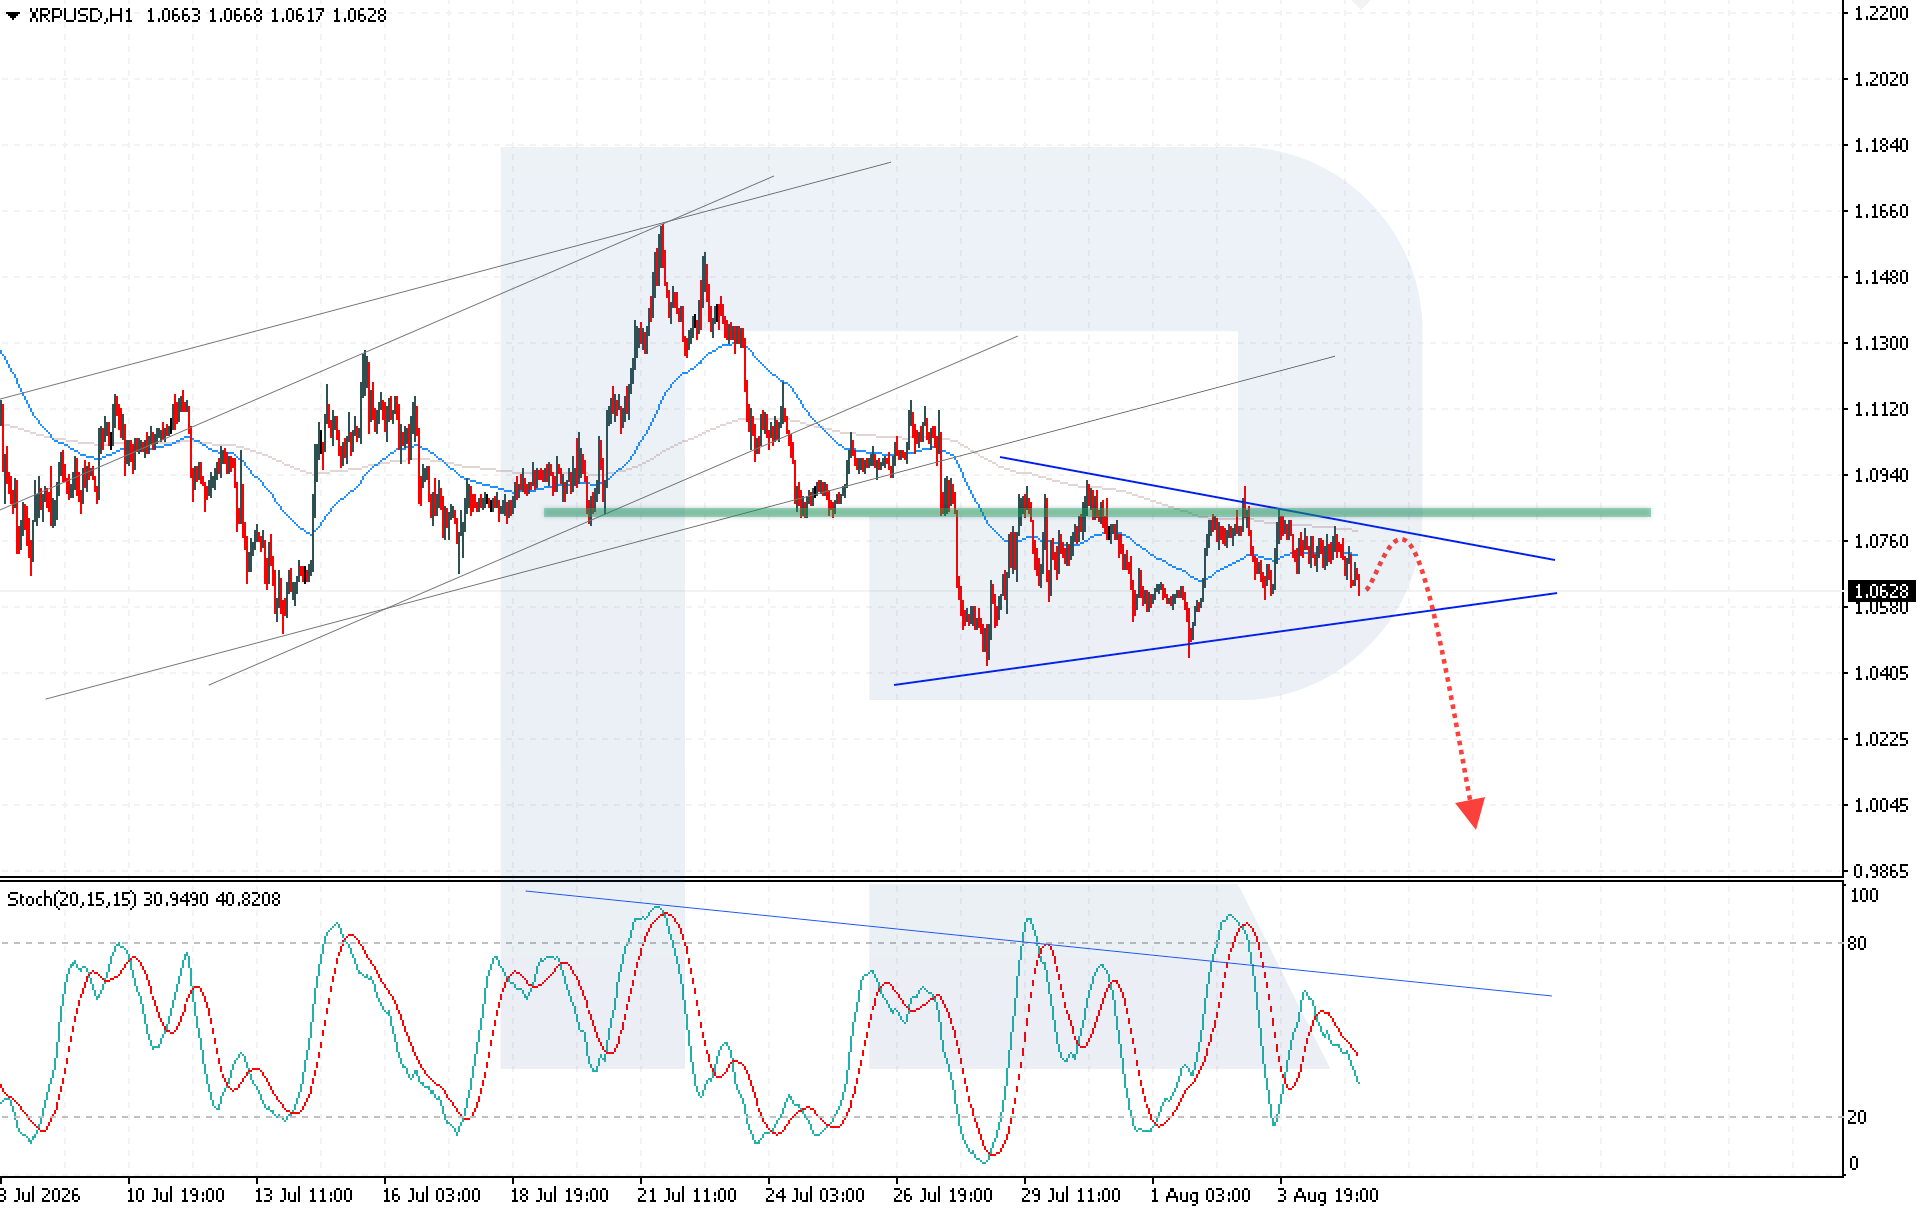
XRP trading scenarios for today
Main scenario (Sell Stop)
A breakout below the lower boundary of the Triangle pattern, with prices falling below 1.0505, would indicate strengthening bearish momentum and create conditions for opening short positions.
- Take Profit: 1.0750
- Stop Loss: 1.0045
Alternative scenario (Buy Stop)
A breakout above the pattern’s upper boundary, followed by consolidation above 1.0905, would invalidate the downside scenario and signal a bullish correction.
- Take Profit: 1.1480
- Stop Loss: 1.0740
Risk factors
The XRPUSD downside scenario could be invalidated if buying activity strengthens and the price consolidates above the 1.0905 resistance level, indicating a possible resumption of the upward movement. Improved sentiment in the cryptocurrency market and reduced regulatory uncertainty surrounding digital assets would be additional risk factors for sellers.
Summary
Today’s XRPUSD analysis indicates selling pressure following a rebound from the upper boundary of the Triangle pattern. A breakout below the 1.0515 support level could pave the way for a further decline towards 1.0045.
Editors’ picks

EURUSD forecast 2026–2027: technical analysis, price levels & predictions
EURUSD has pulled back from the 2026 high of 1.1915 and is now trading near 1.1450 — below both EMA65 and EMA200 — with the active scenario shifting from bullish to bearish. The ECB raised rates to 2.40%, but the Fed holds at 3.75%, and US inflation (3.5%) continues to outpace the eurozone (2.8%). A confirmed break below 1.1280 opens the next downward wave toward 1.1080. We break down the key levels, three trading scenarios with entry triggers, and what Deutsche Bank, Morgan Stanley and UBS are forecasting for EURUSD in 2026.

Gold (XAUUSD) forecast 2026: predictions based on fundamental and technical analysis
Gold has corrected over 25% from its all-time high of 5,597 USD and is now trading near 4,100 USD — testing a critical support zone. Is this the bottom, or will the downtrend continue? We break down the key levels (support 3,920 USD, breakout trigger 4,500 USD), three trading scenarios with entry levels, and what J.P. Morgan, Goldman Sachs and Deutsche Bank are forecasting for gold in 2026.
Ang mga pagtataya na ipinakita sa seksyong ito ay nagpapakita lamang ng pribadong opinyon ng may-akda at hindi dapat ituring bilang gabay para sa pagtetrade. Walang pananagutan ang RoboForex para sa mga resulta ng pagtetrade batay sa mga rekomendasyon sa pagtetrade na inilarawan sa mga analytical review na ito.