
XRP (XRPUSD): what is behind the token’s weakness
The XRP (XRPUSD) price is holding near 1.0205, down 46% since the start of the year. For more details, see our analysis for 12 August 2026.
XRPUSD forecast: key takeaways
- The XRP (XRPUSD) price has paused its decline; the overall backdrop is calm, but XRP may take a tumble
- The main risk is inflation data
- XRPUSD forecast for 12 August 2026: 1.0025 or 1.0353
Fundamental analysis
The XRP price is hovering around 1.0205 on Wednesday. The fundamental backdrop for XRP (XRPUSD) remains mixed. The latest decline accelerated after reports that 200,000 XRP had been withdrawn from the Coreum cross-chain bridge, adding local negative pressure to the market. At the same time, derivatives activity rose sharply, with open interest in XRP futures increasing noticeably ahead of the US CPI release.
Inflation data remains the main macroeconomic driver for the cryptocurrency market. Higher-than-expected inflation could keep bond yields elevated and increase pressure on risk assets. Softer data would support expectations of easier financial conditions.
Since the start of the year, XRP has lost around 46% and significantly underperformed BTC despite several positive developments within the ecosystem. The token has become available to Robinhood clients in the UK, XRP-related products are recording small but steady inflows, and Ripple has received full MiCA authorisation in Europe.
At the same time, XRPL is expanding beyond payments: in June, Ripple introduced the Lending Protocol and AI Starter Kit with support for x402 payments. However, these developments have not yet provided sustained momentum to the price. The main limitation remains that Ripple’s business success does not always translate directly into XRP’s value, while the significant volume of tokens under the company’s control continues to put pressure on the market.
The XRP (XRPUSD) forecast is moderately negative.
Technical outlook
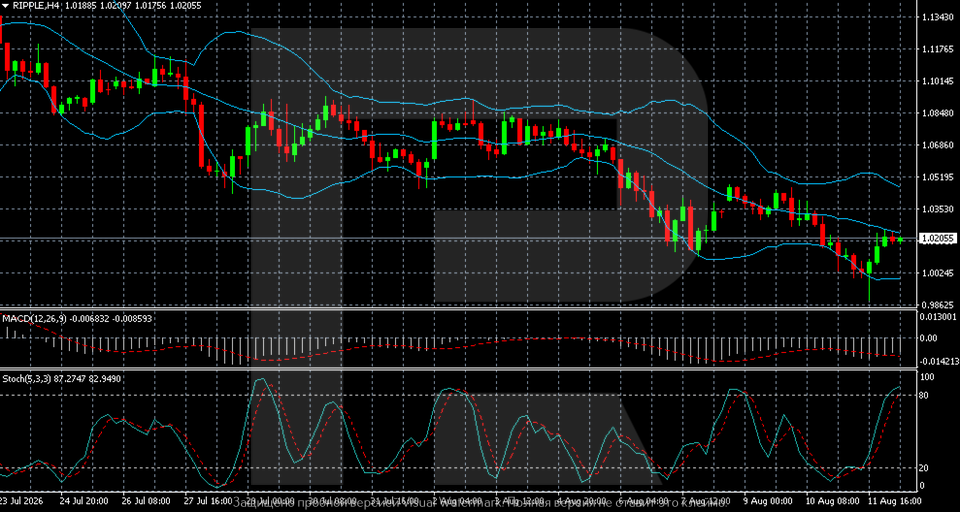
On the H4 chart, XRP (XRPUSD) maintains a downward structure; however, after falling to the 0.9900–1.0000 zone, it formed a noticeable corrective rebound. The price recovered to 1.0205 and approached the middle Bollinger Band. As long as the price remains below this area and local highs, the current move looks more like a recovery within a broader downtrend.
The nearest resistance level is located in the 1.0205–1.0353 zone. Consolidation above 1.0353 would improve the technical outlook and open the way towards 1.0520. Support levels lie at 1.0025 and 0.9863. A return below 1.0025 would increase selling pressure and raise the risk of another test of the recent lows.
MACD remains in negative territory and confirms that the bearish backdrop persists, although selling pressure has eased somewhat. The Stochastic Oscillator has risen above 80 and entered overbought territory, so a pause or local pullback may follow the rapid recovery. The baseline scenario remains movement within the 1.0025–1.0353 range with a neutral-to-negative bias.
XRPUSD overview
- Asset: XRPUSD
- Timeframe: H4 (intraday)
- Trend: downward with a corrective recovery
- Key resistance levels: 1.0353 and 1.0520
- Key support levels: 1.0025 and 0.9863
XRP trading scenarios for today
Main scenario (Sell Stop)
A breakout and consolidation below the 1.0025 support level would confirm renewed downward momentum in XRPUSD and create conditions for further declines.
- Take Profit: 0.9863
- Stop Loss: 1.0120
Alternative scenario (Buy Stop)
A breakout and consolidation above the 1.0353 resistance level would indicate stronger buyer activity and a more sustained upward correction.
- Take Profit: 1.0520
- Stop Loss: 1.0250
Risk factors
The main risk to the XRPUSD downside scenario remains a consolidation above 1.0353, which would significantly improve the short-term technical outlook. Softer US inflation data, lower yields, and an overall improvement in cryptocurrency market sentiment could provide additional support for the token. At the same time, the bearish trend, an overbought Stochastic indicator, and the weak price response to positive ecosystem news continue to favour sellers.
Summary
The XRP price remains under pressure despite the weakening bearish momentum. The XRPUSD forecast for today, 12 August 2026, suggests that the price will remain within the 1.0025–1.0353 range, with downside risks.
Editors’ picks

EURUSD forecast 2026–2027: technical analysis, price levels & predictions
EURUSD has pulled back from the 2026 high of 1.1915 and is now trading near 1.1450 — below both EMA65 and EMA200 — with the active scenario shifting from bullish to bearish. The ECB raised rates to 2.40%, but the Fed holds at 3.75%, and US inflation (3.5%) continues to outpace the eurozone (2.8%). A confirmed break below 1.1280 opens the next downward wave toward 1.1080. We break down the key levels, three trading scenarios with entry triggers, and what Deutsche Bank, Morgan Stanley and UBS are forecasting for EURUSD in 2026.

Gold (XAUUSD) forecast 2026: predictions based on fundamental and technical analysis
Gold has corrected over 25% from its all-time high of 5,597 USD and is now trading near 4,100 USD — testing a critical support zone. Is this the bottom, or will the downtrend continue? We break down the key levels (support 3,920 USD, breakout trigger 4,500 USD), three trading scenarios with entry levels, and what J.P. Morgan, Goldman Sachs and Deutsche Bank are forecasting for gold in 2026.
Ang mga pagtataya na ipinakita sa seksyong ito ay nagpapakita lamang ng pribadong opinyon ng may-akda at hindi dapat ituring bilang gabay para sa pagtetrade. Walang pananagutan ang RoboForex para sa mga resulta ng pagtetrade batay sa mga rekomendasyon sa pagtetrade na inilarawan sa mga analytical review na ito.