
Institutional demand protects XRP from decline
The XRPUSD price is falling, but institutional inflows and expectations of a regulatory breakthrough are keeping the asset from plummeting. The current quote is 1.3468. Discover more in our analysis for 2 September 2026.
XRPUSD forecast: key takeaways
- Whale Alert recorded a scheduled release of 1 billion XRP from Ripple’s escrow holdings
- A vote on the Clarity Act is scheduled for 15 September 2026; if passed, it would establish XRP’s status as a digital commodity
- XRPUSD forecast for 2 September 2026: 1.5005
Fundamental analysis
The XRPUSD price has fallen for the fourth consecutive day, breaking below the crucial 1.3595 support level amid local selling pressure. On a broader timeframe, the downtrend has now continued for the second week, during which the asset has lost more than 20% of its value from the high recorded in August.
The main trigger for the short-term decline was the scheduled release of 1 billion XRP from Ripple’s escrow accounts, recorded by Whale Alert. Although the company traditionally returns up to 60–80% of this amount to escrow, the release of tokens onto the market itself triggered speculative selling.
Nevertheless, a strong fundamental backdrop restrains a deeper decline. First, US spot XRP ETFs reported their best week of 2026, with net capital inflows into the funds reaching 110.49 million USD by 28 August and surpassing the May records. Second, long-term investors are focused on 15 September 2026, when the US Senate is due to vote on the Clarity Act. If the bill is passed, XRP would officially be recognised as a digital commodity under CFTC oversight, permanently removing the SEC’s legal leverage over the asset.
Technical outlook
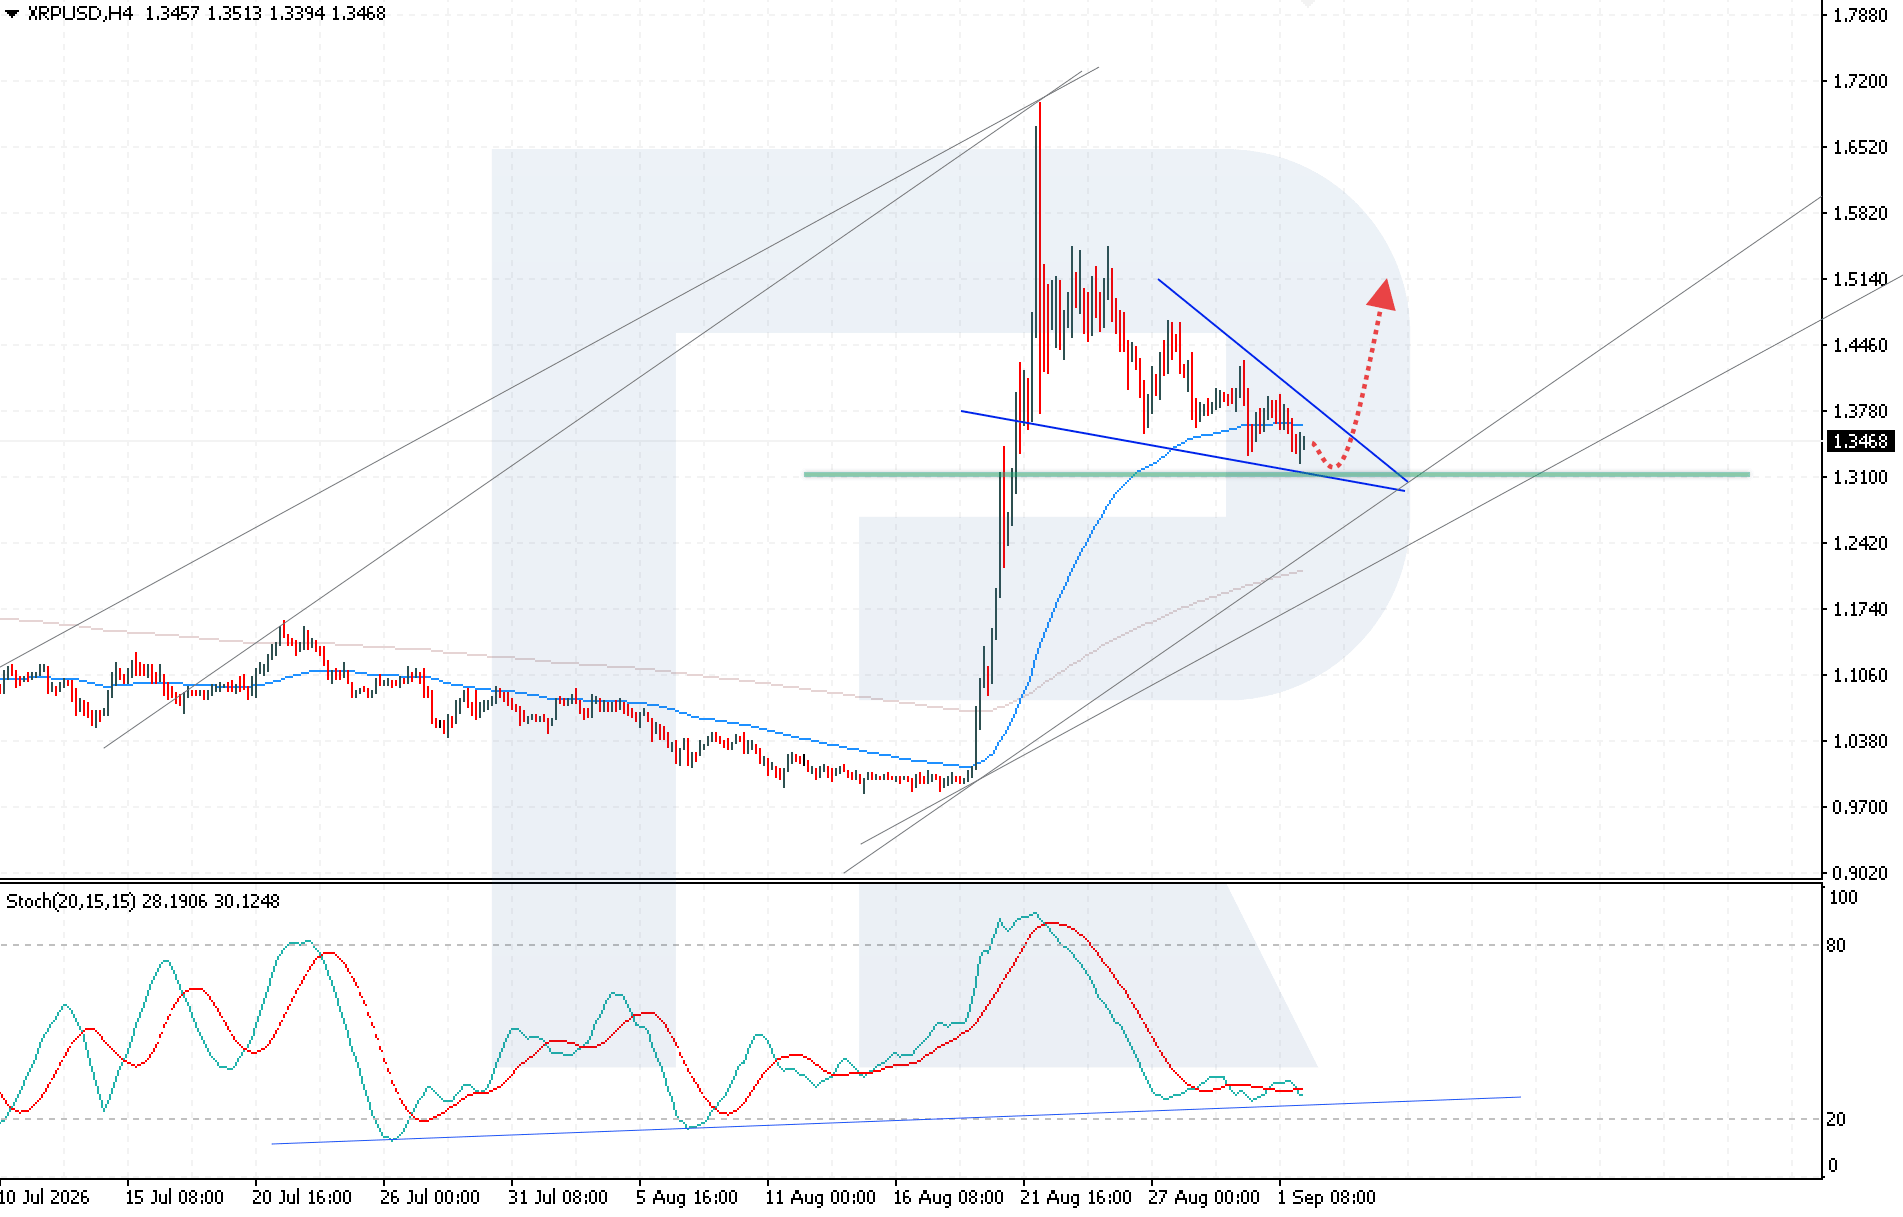
The XRPUSD price is declining within a Wedge reversal pattern. Despite selling pressure, a breakout above the pattern’s upper boundary could trigger price growth. Today’s XRPUSD forecast suggests a rebound from the lower boundary of the pattern and a rise towards 1.5005.
The technical picture remains favourable for the downside scenario. The Stochastic Oscillator is rebounding from the support line, signalling a potential upward reversal. Additional confirmation of XRPUSD growth would come from a breakout above the upper boundary of the Wedge pattern, followed by consolidation above 1.3655, which would indicate the end of the corrective phase and renewed bullish momentum.
An alternative scenario suggests increased selling pressure if the local support level is broken. If the price falls below 1.3205, this would signal a deeper decline.
XRPUSD overview
- Asset: XRPUSD
- Timeframe: H4 (intraday)
- Trend: bullish
- Key resistance levels: 1.3655 and 1.4105
- Key support levels: 1.3205 and 1.2550
XRP trading scenarios for today
Main scenario (Buy Stop)
A breakout above the upper boundary of the Wedge reversal pattern, followed by consolidation above 1.3655, would signal the beginning of a price movement towards the pattern’s first target at 1.5005 and create conditions for opening long positions.
- Current price: 1.3468
- Entry level: 1.3655
- Take profit: 1.5005
- Stop loss: 1.3250
- Risk-to-reward ratio: more than 1:3
Alternative scenario (Sell Stop)
A breakout below the pattern’s lower boundary, followed by consolidation below 1.3205, would invalidate the Wedge reversal pattern and signal continued downward momentum.
- Entry level: 1.3200
- Take profit: 1.2500
- Stop loss: 1.3460
- Risk-to-reward ratio: more than 1:2
The trade idea is valid until midnight on 6 September 2026 (server time, UTC+3).
Risk factors
The main risk to the upside scenario is prolonged speculative pressure caused by the release of 1 billion XRP, which could push the price below key local support levels. If sellers retain the initiative, a technical breakout below 1.3205 could develop into a full-scale downward momentum.
Summary
The current decline in XRP is temporary, as speculative pressure from token unlocks is being offset by institutional capital inflows. In the long term, XRPUSD movements will be determined by the historic vote on the Clarity Act in the US Senate, which could completely eliminate regulatory risks.
Editors’ picks

EURUSD forecast 2026–2027: technical analysis, price levels & predictions
EURUSD has recovered from the July lows and is trading near 1.1545 — back in bullish territory. The pair has reclaimed EMA65 on the daily, formed a bullish EMA crossover on H4, and the US-eurozone GDP gap has narrowed sharply (US 1.5% vs eurozone 1.0%). Goldman Sachs and Deutsche Bank both now target 1.2500 by year-end. A confirmed close above 1.1700 opens the path to 1.1805. We break down the key levels, three trading scenarios, and what the unprecedented 9-3 FOMC dissent vote means for EURUSD.

Gold (XAUUSD) forecast 2026: technical analysis, price levels & predictions
Gold has reversed its downtrend and is trading near 4,360 USD, back above both EMA65 and EMA200. ETF flows turned positive in July with 3 billion USD of net inflows, and central banks bought 288.9 tonnes in Q2 — up 62% year-on-year. A breakout above 4,500 USD opens the path to 4,855 USD and the 5,597 USD all-time high. We break down the key levels, three trading scenarios with entry triggers, and what J.P. Morgan, Deutsche Bank and Goldman Sachs are forecasting for gold in 2026.
Ang mga pagtataya na ipinakita sa seksyong ito ay nagpapakita lamang ng pribadong opinyon ng may-akda at hindi dapat ituring bilang gabay para sa pagtetrade. Walang pananagutan ang RoboForex para sa mga resulta ng pagtetrade batay sa mga rekomendasyon sa pagtetrade na inilarawan sa mga analytical review na ito.