US 30 index forecast: the index hits a new all-time high
The US 30 index reached a new all-time high, but failed to consolidate above the resistance level. The US 30 forecast for today is positive.
US 30 forecast: key takeaways
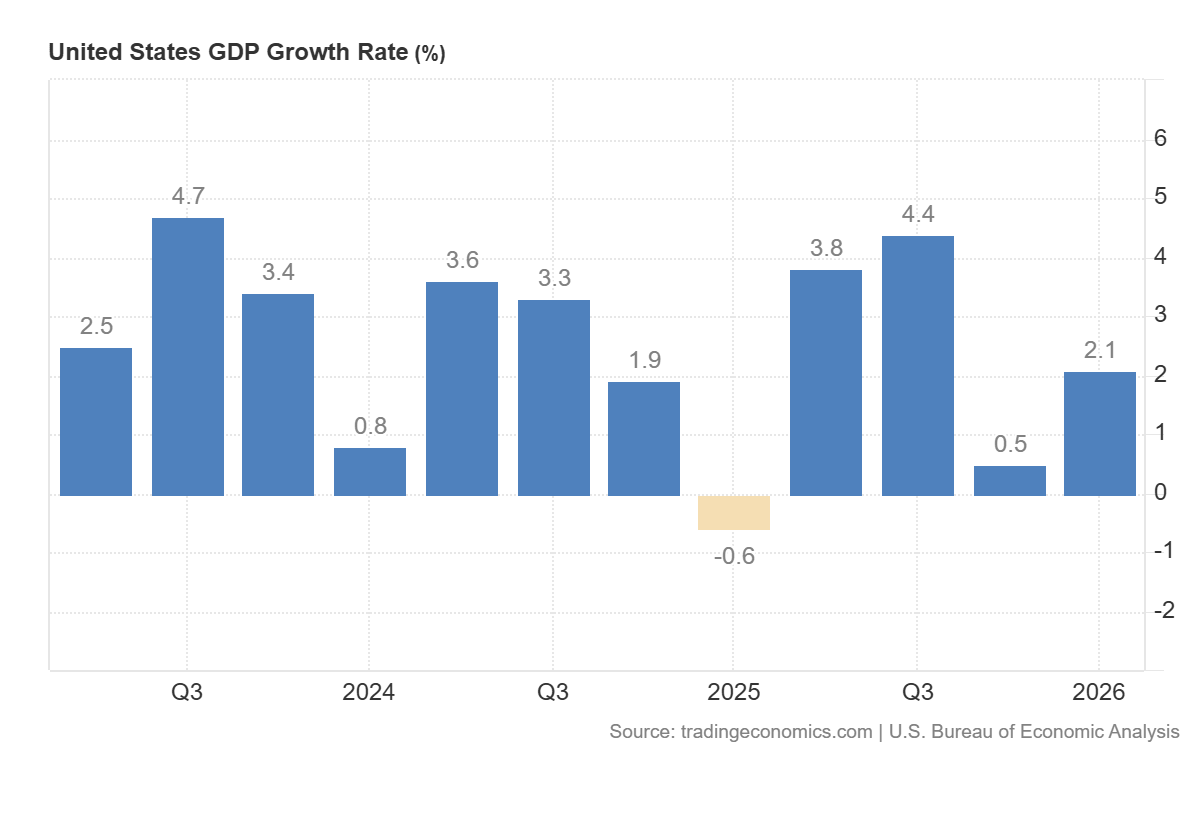
- Recent data: US GDP grew by 2.1% in Q1 2026
- Market impact: the data has a positive impact on the stock market
US 30 fundamental analysis
The quarterly US GDP data looks positive for the US 30 index, as actual economic growth reached 2.1%, above the forecast of 1.6% and the previous reading of 0.5%. This result shows that the US economy is more resilient than the market expected. For the US 30 index, this may act as a supportive factor, as it includes large companies from industry, the financial sector, healthcare, consumer segments, and other sectors sensitive to overall business activity.
For the US 30 index, this news may generally be viewed positively, as stronger economic growth typically improves expectations for corporate revenue and earnings. Investors may conclude that consumer demand, investment activity, and the business environment remain sufficiently resilient. This is especially important amid concerns about an economic slowdown: if GDP grows faster than expected, the likelihood of a sharp deterioration in corporate performance declines.
US 30 technical analysis
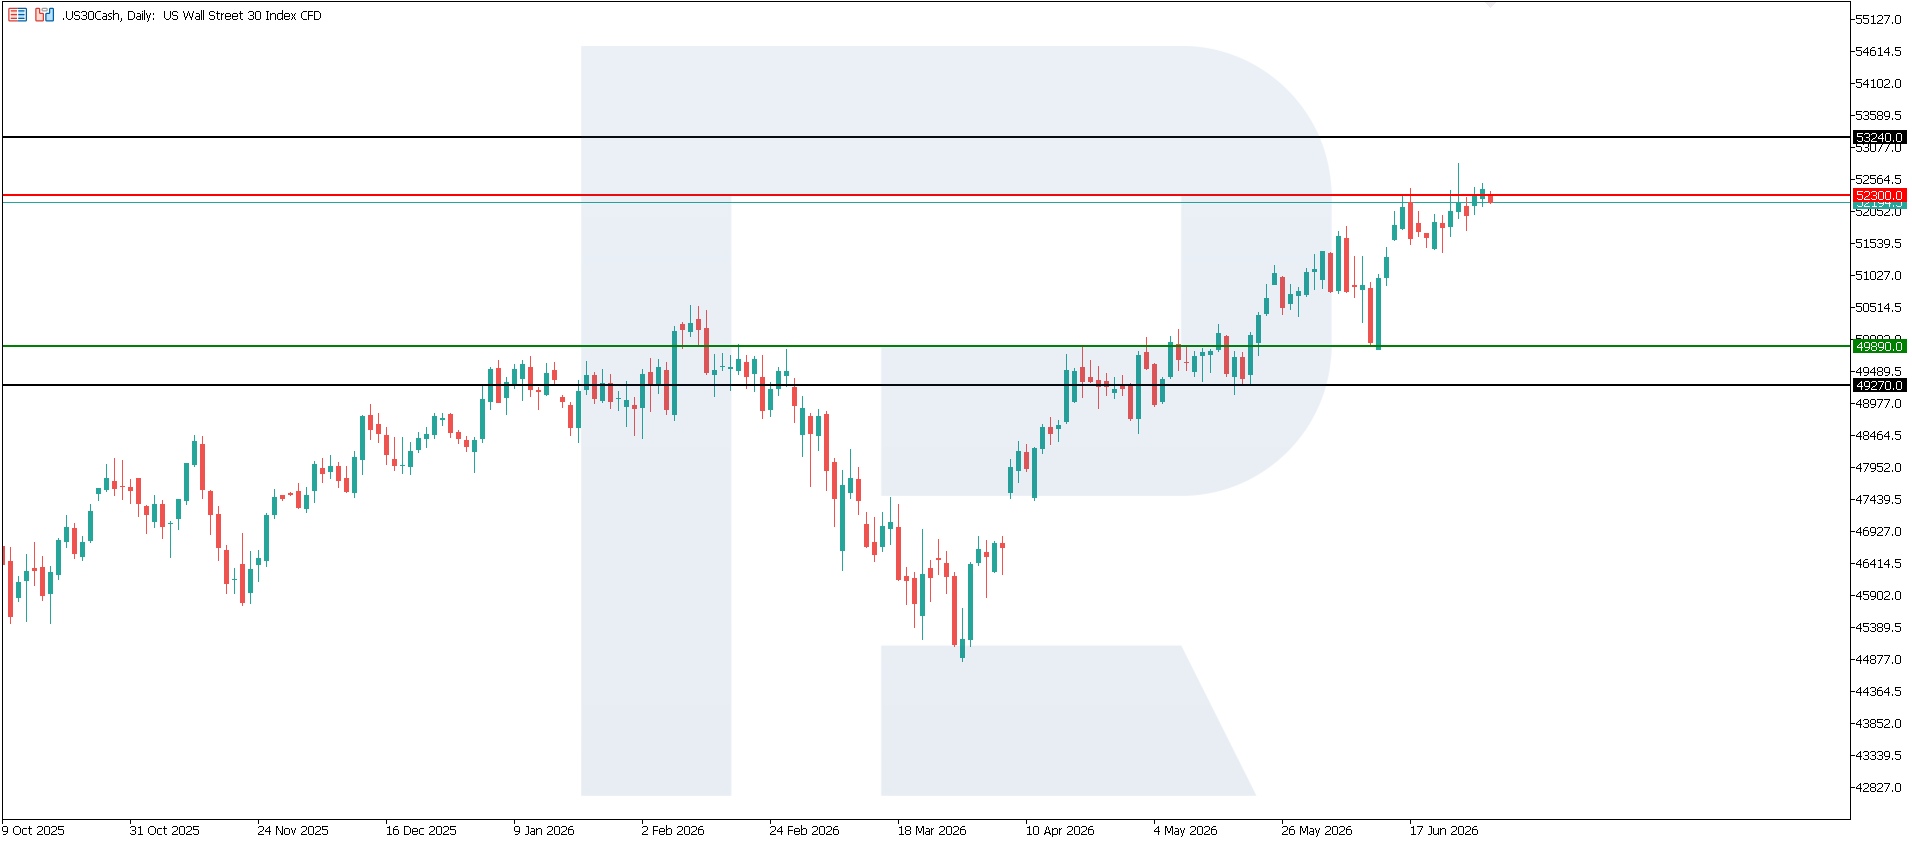
The US 30 index hit a new all-time high but failed to gain a firm foothold above the resistance level. The nearest support level formed at 49,890.0, with resistance at 52,300.0. The price currently continues to test the resistance level. If the current trend persists, the nearest upside target could be 53,240.0.
The US 30 price forecast considers the following scenarios:
- Pessimistic US 30 scenario: a breakout below the 49,890.0 support level could push the index down to 49,270.0
- Optimistic US 30 scenario: a breakout above the 52,300.0 resistance level could propel the index up to 53,240.0
Summary
Overall, stronger-than-forecast US GDP data is a moderately positive signal for the US 30 and the US stock market. It reduces concerns about economic weakness and supports expectations for stable corporate earnings. However, the index’s further movement will depend on which factor proves stronger for investors: confidence in sustainable economic growth or concerns that robust data will allow the Federal Reserve to delay monetary policy easing for longer. The nearest upside target could be 53,240.0.
Editors’ picks

EURUSD forecast 2026–2027: technical analysis, price levels & predictions
The ECB holds rates at 2.15% while the Fed stays at 3.75% — and that divergence is the central driver of EURUSD in 2026. The pair is range-bound between 1.1400 and 1.1915, with Deutsche Bank targeting 1.2500 and Morgan Stanley calling for 1.3000 by year-end. We analyse the technicals, break down the macro factors, and outline three trading scenarios with specific entry levels.

Gold (XAUUSD) forecast 2026: predictions based on fundamental and technical analysis
Where is gold headed after pulling back from the all-time high of 5,597 USD? XAUUSD is consolidating near 4,518 USD between key levels 4,220 USD and 4,855 USD, with major banks targeting 5,243–6,200 USD by year-end. Read our comprehensive gold forecast: technical analysis across three timeframes, trading scenarios with specific entry levels, Fed policy and central bank demand outlook, and institutional predictions for 2026 and beyond.
Ang mga pagtataya na ipinakita sa seksyong ito ay nagpapakita lamang ng pribadong opinyon ng may-akda at hindi dapat ituring bilang gabay para sa pagtetrade. Walang pananagutan ang RoboForex para sa mga resulta ng pagtetrade batay sa mga rekomendasyon sa pagtetrade na inilarawan sa mga analytical review na ito.