EURUSD Forecast 2026–2027: Technical Analysis, Price Levels & Predictions
Disclaimer: This article is prepared on the basis of reputable financial sources and analytical data from RoboForex specialists. It reflects the conclusions of thorough research; however, economic changes may significantly affect market conditions and alter the EURUSD forecast. We recommend conducting your own research and consulting with professionals before making financial decisions.
EURUSD is trading near 1.1450 as of mid-July 2026, having declined from the June high of 1.1630 as the active scenario shifted from bullish to bearish. The pair has crossed below both EMA65 and EMA200 on the daily chart and is now testing the lower Bollinger Band on the weekly — a zone that could trigger a short-term bounce, but the broader structure favours further downside. The key factors driving this shift: ECB raised its key rate to 2.4% at the June 10–11 meeting while the Fed held at 3.75%, the US–eurozone inflation differential remains at 0.7 percentage points in favour of the US (3.5% vs 2.8%), and GDP growth continues to diverge significantly (US +2.1% vs eurozone +0.8% in Q1). A confirmed break below 1.1280 would signal the next downward wave. A close above 1.1500 is required to restore the bullish bias.
Key takeaways: EURUSD forecast
- Market structure: Sideways trend with corrective elements following a decline from the 2026 high of 1.1915. Price near 1.1450, between key support and resistance.
- Key resistance: 1.1500 (psychological level) / 1.1805 (upper Bollinger Band) — a confirmed close above 1.1500 restores the bullish bias.
- Key support: 1.1280 (former resistance, now key support) / 1.1080 — a weekly close below 1.1280 confirms the next downward wave.
- Active scenario: Bearish — after the sideways phase resolves, price is likely to test 1.1280 and potentially 1.1080.
- Main risk: Fed tightening under Kevin Warsh if inflation reaccelerates; escalation of the Middle East conflict driving energy inflation.
| Horizon | Range | Bias |
|---|---|---|
| This week | 1.1377 – 1.1472 | Bearish |
| This month | 1.1323 – 1.1664 | Bearish |
| End of 2026 | 1.1000 – 1.3000 | Bullish |
| 2027 | 1.1000 – 1.3000 | Bullish |
EURUSD technical analysis
The analysis below covers the Daily (D1), H4 and Weekly (W) timeframes. The dominant picture across all three is a transition from a defined uptrend (which peaked at 1.1915) into a corrective downtrend, now in a sideways consolidation phase. On the daily chart, early recovery signals (MACD and Stochastic on Buy) suggest a short-term bounce is possible, but the weekly and monthly indicators remain on Sell, keeping the intermediate bias bearish. The decisive level to watch is 1.1280: a confirmed weekly close below it opens the next downward wave.
Indicator summary
| Indicator | Daily (D) | Weekly (W) | Monthly (M) |
|---|---|---|---|
| MA 65 / 200 | Sell | Sell | Neutral |
| RSI (14) | Neutral | Sell | Sell |
| MACD (12/26/9) | Buy | Neutral | Sell |
| Stochastic (20/15/15) | Buy | Neutral | Neutral |
| Overall signal | Buy | Neutral | Neutral |
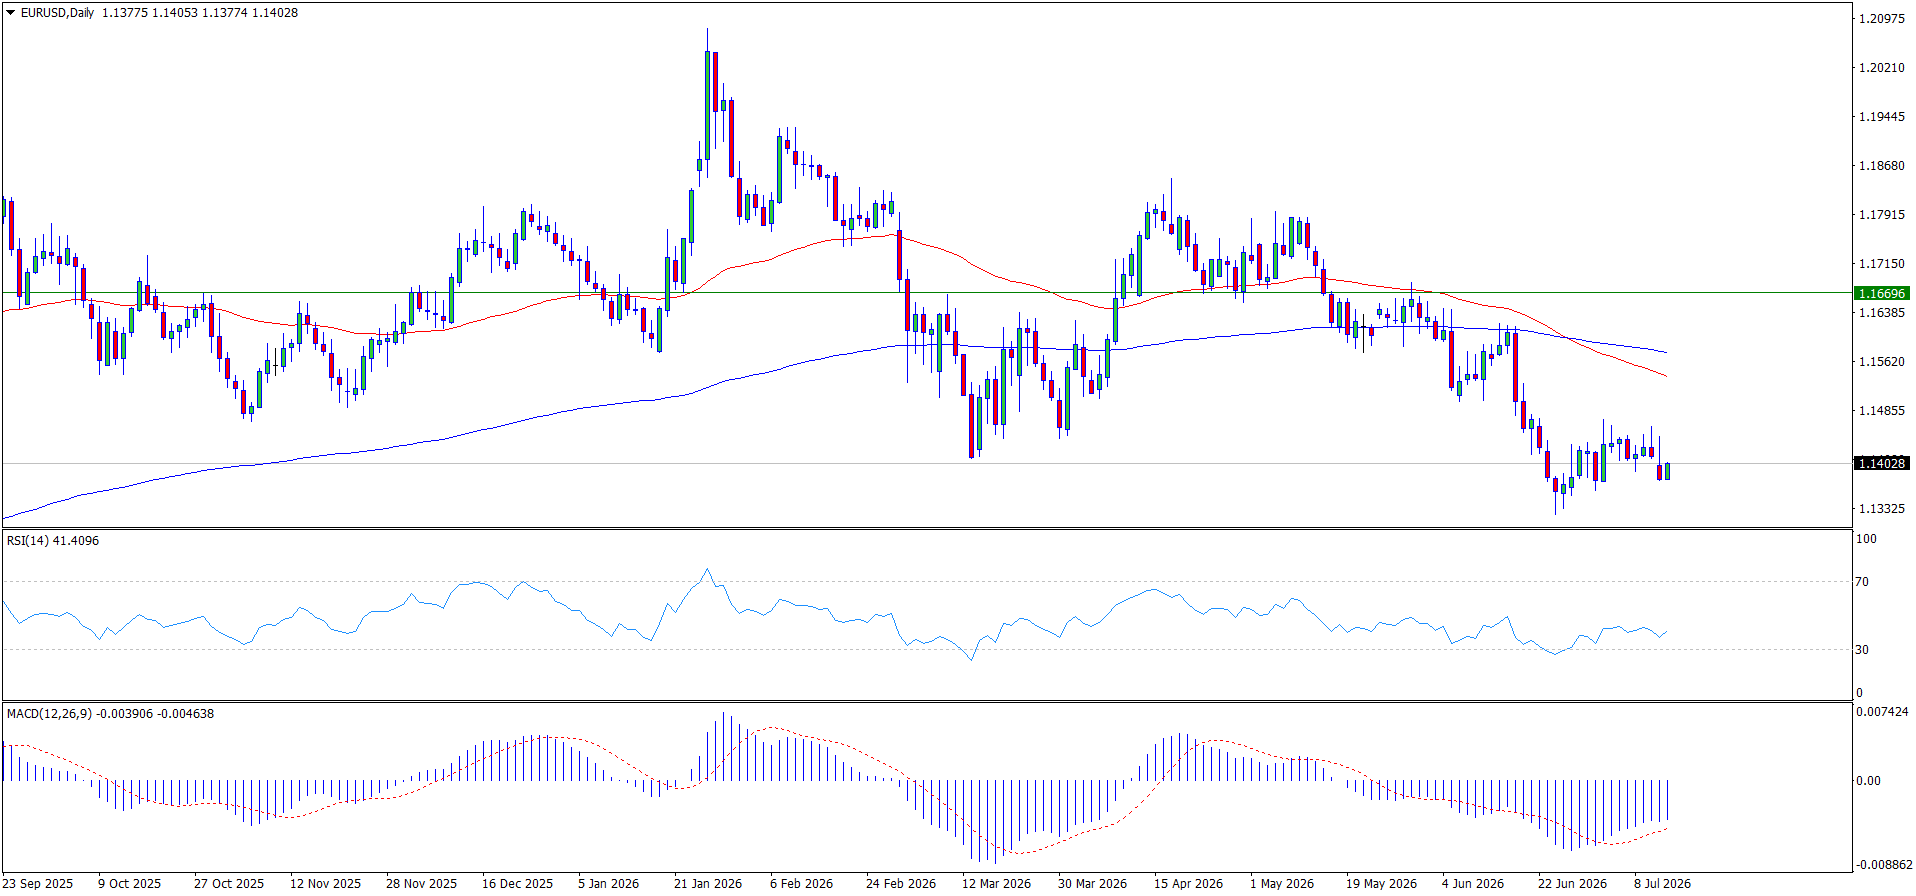
Daily timeframe (D1)
On the D1 chart, EURUSD has crossed EMA65 and EMA200 from top to bottom — the crossover occurred in June 2026 — and is now forming a sideways consolidation pattern near the moving averages. The EMAs, which previously acted as dynamic support, have now flipped to resistance: price is trading below both and failing to reclaim them on a sustained basis. The price action over recent weeks shows no clear attempt at either a pronounced recovery or an accelerated decline — the pair is waiting for a catalyst.
RSI14 continues to move sideways between levels 30 and 70, reflecting the indecisive price action. The MACD histogram is below zero but gradually contracting, and the signal line has exited the histogram zone — an early constructive signal that may precede a bounce. The optimal approach under current conditions is to wait for a confirmed directional signal: RSI14 crossing level 70 from below (bullish) or level 30 from above (bearish), combined with the MACD histogram crossing the zero line from below. These convergent signals would provide high-confidence directional confirmation for EURUSD.
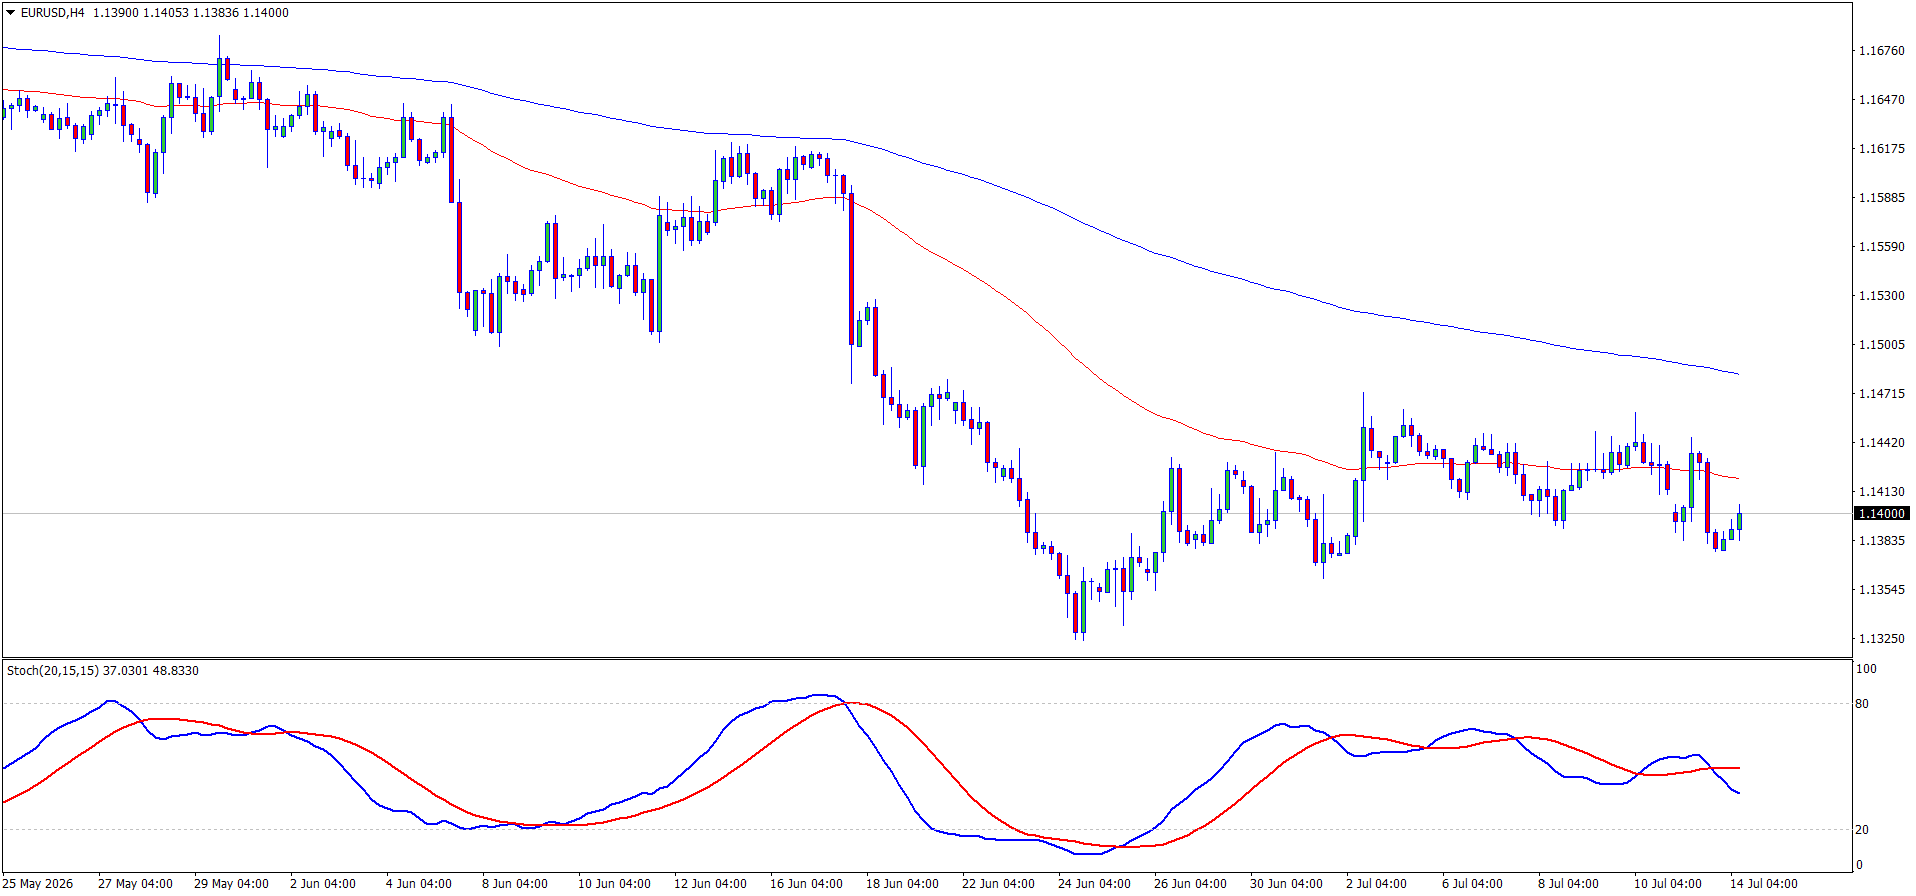
H4 timeframe
On the H4 chart, EURUSD is trading near 1.1400. Price has bounced from EMA200 and is periodically crossing EMA65, reflecting short-term oscillation around the moving average without a clear sustained direction. Following the EMA65/EMA200 crossover, both moving averages continue to slope lower and are tracking close to the price — a sign that the market is in a neutral wait-and-see mode, searching for triggers to determine the next directional leg.
The Stochastic oscillator (20/15/15) turned lower without reaching the 80 overbought zone and is now heading toward the oversold area — a signal that a short-term downward wave is forming. If this downward impulse materialises, the first support target is 1.1325, with 1.1280 as the next significant level. Before the decline extends, a deeper corrective pullback toward 1.1500 should not be excluded — this level could act as a resistance test before sellers resume control.
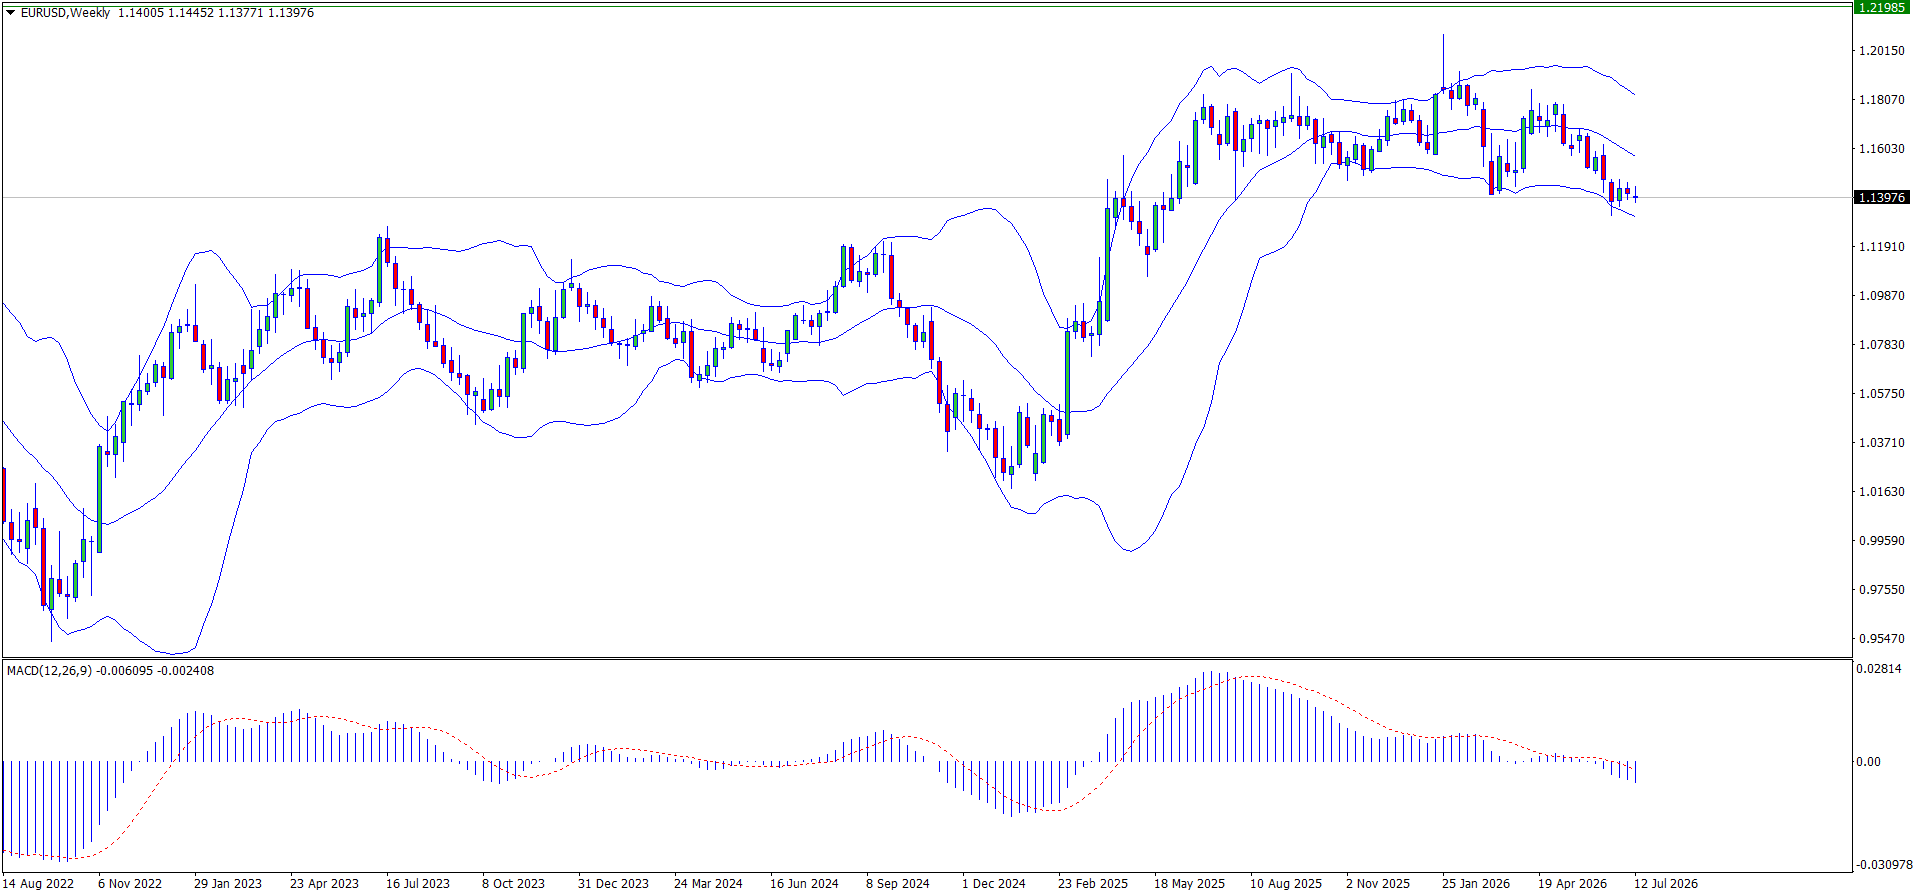
Weekly timeframe (W)
On the weekly chart, EURUSD is testing the 1.1400 zone near the lower Bollinger Band. Historically, the lower Bollinger Band has acted as a support reference that can trigger corrective bounces — and at current levels, a short-term pullback toward the middle Band is a plausible near-term scenario. However, price is now moving horizontally after the decline from the 2026 high, and the overall weekly structure has turned bearish.
The MACD histogram has crossed below the zero line and is gradually deepening, with the signal line also below zero — a confirmation that intermediate-term selling pressure is now dominant, not merely corrective. In the long-term picture, the most likely scenario is a short-term bounce (corrective pullback) followed by a resumption of the downtrend. A confirmed weekly close below 1.1280 would signal the start of a new downward wave and shift the long-term bias from neutral to bearish.
Trading scenarios
Bullish scenario
A confirmed close above 1.1500 signals buyer dominance and a breakout from the resistance zone, opening continuation toward the 2026 highs. This scenario requires a reversal of the current bearish momentum.
| Entry trigger | Close above 1.1500 |
| Invalidation | Close back below 1.1500 |
| Target 1 | 1.1805 |
| Target 2 | 1.1915 |
Bearish scenario
A break below 1.1280 signals a strengthening of sellers and continued USD appreciation, extending the downtrend toward the next structural support levels.
| Entry trigger | Close below 1.1280 |
| Invalidation | Recovery above 1.1280 |
| Target 1 | 1.1080 |
| Target 2 | 1.1000 |
Sideways scenario
If price continues consolidating between 1.1280 and 1.1500, range trading from the boundaries is viable: buy near support on a failed breakdown, targeting the upper boundary; sell near 1.1500 resistance targeting the lower boundary.
| Range top | 1.1500 |
| Range bottom | 1.1280 |
| Breakout up | 1.1500 → 1.1805 |
| Breakdown | 1.1280 → 1.1080 |
Key EURUSD price levels
The following levels are derived from structural analysis across the Daily, H4 and Weekly timeframes — historical swing highs and lows, Bollinger Band reference zones and key psychological round numbers.
| Type | Level | Significance |
|---|---|---|
| Resistance 3 (R3) | 1.1915 | Historical reversal zone — price bounced from this level and changed direction on multiple occasions |
| Resistance 2 (R2) | 1.1805 | Upper Bollinger Band on the weekly chart — has acted as insurmountable resistance with multiple clear rejections |
| Resistance 1 (R1) | 1.1500 | Psychological round number — price has historically paused near this level and bounced; now the key near-term resistance |
| Pivot (P) | 1.1450 | Lower Bollinger Band test zone — current price area with multiple recent bounces; key equilibrium reference |
| Support 1 (S1) | 1.1200 | Former multi-year resistance broken on the third attempt — now a structural support level |
| Support 2 (S2) | 1.1000 | Psychological round number — price has historically paused near this level with multiple bounces |
| Support 3 (S3) | 1.0000 | EUR/USD parity — extreme downside reference and major historical inflection point |
Key intermediate level — 1.1280: This level is not in the main table above but is operationally the most important for the current forecast: it is the former resistance that price broke through on the third attempt, and a confirmed weekly close below 1.1280 is the trigger for the bearish scenario toward 1.1080–1.1000.
Psychological levels: At round numbers — 1.0000, 1.1000, 1.1200, 1.1400, 1.1500 and beyond — price has historically bounced multiple times before breaking through. When a breakout fails to sustain, these levels become turning points where the prevailing trend reverses.
EURUSD forecast by horizon
Short-term expectations are expressed through level-based conditions to remain valid between reviews. The near-term (week/month) bias has shifted to bearish, while the longer-term (2026 year-end / 2027) outlook remains contingent on the Fed easing cycle beginning and the eurozone avoiding recession.
| Horizon | Range | Average | Bias |
|---|---|---|---|
| This week | 1.1377 – 1.1472 | ~1.1425 | Bearish |
| This month | 1.1323 – 1.1664 | ~1.1490 | Bearish |
| End of 2026 | 1.1000 – 1.3000 | ~1.2000 | Bullish |
| 2027 | 1.1000 – 1.3000 | ~1.2100 | Bullish |
The divergence between near-term bearish and long-term bullish reflects the structure of the correction: the near-term downside is driven by the Fed/ECB rate differential and the current corrective wave, while the year-end bullish case is contingent on the Fed beginning to ease as US inflation approaches 2%. Key catalysts to watch: the July 28–29 FOMC meeting, the July 22–23 ECB meeting, and the Q2 GDP data for both regions on July 30.
What drives the EURUSD price
EURUSD is driven by the relative economic performance of the US and the Eurozone. The exchange rate reflects which side appears stronger relative to the other — in terms of monetary policy, inflation, growth, and risk appetite — rather than the absolute strength of either currency.
ECB monetary policy
At its June 10–11, 2026 meeting, the European Central Bank raised its key rate by 25 basis points to 2.40%, sending a clear signal that the fight against inflation remains the priority even as eurozone growth prospects deteriorate. The ECB confirmed it is prepared to maintain a restrictive monetary policy stance until there are convincing and sustained signs of inflation returning to the 2% target. Future decisions will be fully data-dependent. The next meeting is scheduled for July 22–23, 2026. A further rate hike — or even a hawkish hold — would narrow the ECB/Fed rate differential and provide support for the euro.
Federal Reserve policy
The FOMC held the federal funds rate at 3.50%–3.75% at its June 16–17, 2026 meeting. Persistent inflation pressure was the central theme of deliberations: members noted that despite progress in reducing inflation from prior peaks, recent data point to risks of re-acceleration. The Fed therefore considers it premature to pivot toward rate cuts. Particular attention was paid to external risks — geopolitical tensions, energy price increases and potential trade restrictions — and their inflationary impact. The next FOMC meeting on July 28–29 is a key event: any shift in rhetoric toward a more neutral stance would be materially euro-positive.
Inflation differential (Eurozone vs US)
The latest data show cooling inflation on both sides of the Atlantic, but the differential remains. Eurostat's preliminary June 2026 estimate shows eurozone CPI slowing to 2.8% (from 3.2% in May), driven by easing energy and services price growth. In the US, the June CPI published on July 14 showed inflation cooling to 3.5% year-on-year (from 4.2% in May), primarily reflecting a sharp fall in energy prices that temporarily offset persistent services and core inflation pressure. The current differential is approximately 0.7 percentage points in the US's favour. While this gap is narrowing, it continues to support expectations for a more hawkish Fed relative to the ECB, which supports USD and limits EURUSD upside. If US inflation continues to cool faster than eurozone inflation, ECB/Fed expectations could converge — a positive scenario for the euro.
GDP growth differential
US Q1 2026 GDP grew 2.1% year-on-year, sustained by investment and consumer spending. Q2 2026 data will be released on July 30 — consensus expects 1.6%–2.2% growth. Eurozone Q1 2026 GDP grew 0.8% year-on-year (+0.3% quarter-on-quarter), the weakest reading in several quarters, reflecting the drag from expensive energy and weak industrial activity. Q2 eurozone data also due July 30, with analysts expecting a modest ~+0.1% quarter-on-quarter after Q1's near-stagnation. The growth differential remains a structural argument for USD strength and EURUSD downside pressure: until European growth accelerates meaningfully, investors will continue to prefer dollar-denominated assets.
Geopolitics, trade & USD index
The US Dollar Index (DXY) is trading near 100.75, forming a consolidation after a recent rise, supported by hawkish Fed expectations, elevated US Treasury yields and safe-haven demand. The Middle East conflict continues to push oil prices higher — a dynamic that hits the energy-import-dependent eurozone harder than the US, adding to inflation pressures in Europe and compressing the region's trade balance. The US administration continues to signal potential tariff expansion against trading partners including the EU, maintaining uncertainty in global trade flows and supporting the safe-haven bid for USD. Active US–EU negotiations aimed at preventing a full-scale tariff conflict are ongoing, which limits the negative impact on the euro but does not fully eliminate the uncertainty premium.
What could push EURUSD lower
- Fed tightening (rates higher for longer): A hawkish FOMC statement at the July 28–29 meeting — or a rate hike signal — would increase USD yield attractiveness further and widen the ECB/Fed differential to the dollar's advantage.
- Sustained DXY rally (above 105): A DXY breakout above 105 would trigger additional capital rotation into USD, driven by yield-seeking investors and safe-haven flows.
- Eurozone economic slowdown / recession risk: With eurozone growth near stagnation, further energy price increases could push the already-fragile industrial sector into contraction, increasing the probability of a recession scenario.
- ECB cutting rates faster than Fed: A premature ECB pivot toward easing — if eurozone growth deteriorates sharply — would widen the rate differential in the dollar's favour and could push EURUSD toward parity.
- Geopolitical escalation reducing risk appetite: Further Middle East escalation would drive investors into safe-haven assets, predominantly USD, at the expense of the euro.
Bank & institution forecasts
Despite the near-term bearish pressure, the majority of major institutions maintain bullish year-end targets for EURUSD, ranging from 1.2000 to 1.3000. The consensus reflects the expectation that the Fed will begin easing later in 2026 as US inflation approaches 2%, which would narrow the rate differential that is currently weighing on the euro. Citi Research remains the notable exception with a bearish 1.1000 target.
| Institution | Target | Horizon | Date |
|---|---|---|---|
| Morgan Stanley | 1.3000 | End of 2026 | 3 Jun 2026 |
| Deutsche Bank | 1.2500 | End of 2026 | 29 Apr 2026 |
| Bank of America | 1.2200 | End of 2026 | May 2026 |
| ING | 1.2200 | End of 2026 | Spring 2026 |
| UBS | 1.2000 | December 2026 | 26 May 2026 |
| Citi Research | 1.1000 | End of 2026 | Spring 2026 |
Long-term EURUSD outlook (2027)
Long-term EURUSD forecasts remain wide — 1.1000 to 1.3000 — reflecting genuine uncertainty around the pace of Fed and ECB rate normalisation and the relative recovery trajectories of the two economies. The bull case (1.2500–1.3000) requires a Fed easing cycle beginning in late 2026, eurozone growth stabilising above 1%, and resolution of current geopolitical headwinds. The bear case (1.0500–1.1000) requires sustained Fed hawkishness, continued eurozone underperformance, and a structural safe-haven bid for USD. RoboForex Analysis Department's base case for 2027 places the pair in the 1.1000–1.3000 range with a bullish medium-term bias, contingent on Fed easing and no eurozone recession. Key catalysts in the near term: ECB meeting July 22–23 and FOMC July 28–29 — both have the potential to materially shift the 2026 year-end outlook.
How to trade EURUSD
EURUSD offers multiple ways to gain exposure, each suited to different trading styles, time horizons and risk appetites.
| Instrument | Leverage / cost | Best suited for |
|---|---|---|
| CFD on EURUSD | High leverage available; spread + overnight swap | Short- and medium-term traders seeking directional exposure |
| FX spot / forwards | Competitive spreads; no overnight swap for spot | Day traders and institutional hedgers |
| FX options | Premium cost; defined risk for buyers | Hedgers and traders seeking asymmetric exposure |
| Currency ETF | No leverage; management fee; exchange-traded | Medium- to long-term portfolio allocation |
Trade EURUSD with tight spreads on MobileTrader and MetaTrader 5.
Open an accountPros and cons of trading EURUSD
Pros
- Highest liquidity globally: EURUSD accounts for roughly 20–25% of daily global forex volume, ensuring tight spreads and deep order books at any time of day.
- Predictable macro drivers: Clear, well-documented relationship with ECB/Fed policy, inflation data and GDP makes it ideal for fundamental analysis.
- Low transaction costs: Extremely tight spreads — often sub-pip on ECN accounts — make it cost-efficient for frequent traders.
- 24-hour market: Trades continuously from Sunday evening through Friday close, with peak activity during London and New York sessions.
- Rich data environment: Dense schedule of high-impact releases (CPI, NFP, ECB/FOMC decisions) creates regular tradeable volatility events.
Cons
- Complex macro dependencies: EURUSD reacts to two separate central banks, two inflation regimes and two growth cycles — misreading any one can invalidate a trade.
- Sudden policy pivots: Unexpected ECB or Fed rhetoric shifts can cause 100–200 pip moves within minutes, catching stops in both directions.
- Leverage risk (CFD): High leverage amplifies losses proportionally; a 1% adverse move on 1:100 leverage wipes out the full margin.
- Geopolitical sensitivity: Safe-haven USD demand during risk-off episodes can override fundamental or technical setups entirely.
- Low yield carry: With rates on both sides of the Atlantic at multi-year highs, carry trade opportunities are limited compared to EM pairs.
EURUSD forecast methodology
How we build the forecast
- Technical analysis (three timeframes). We analyse the Daily (D1), H4 and Weekly (W) EURUSD charts. On each timeframe we identify market structure, key support and resistance levels, and signals from trend indicators (MA 65/200, Bollinger Bands) and oscillators (RSI 14, MACD 12/26/9, Stochastic 20/15/15).
- Fundamental analysis. We track the key EURUSD drivers: ECB rate decisions (source: ecb.europa.eu), Fed rate decisions (source: federalreserve.gov), inflation data for both regions, GDP growth differentials, the US Dollar Index (DXY) and the geopolitical and trade policy environment.
- Institutional forecast consensus. We aggregate the latest published targets from major investment banks (Deutsche Bank, Morgan Stanley, UBS, BofA and others) sourced from official publications and verified through Reuters and Bloomberg.
- Update schedule. This article is reviewed by RoboForex Analysis Department at least once per month. Unscheduled updates are published following significant market events (ECB/FOMC decisions, major CPI or GDP releases, sharp price moves). The date of the most recent review is shown at the top of the article.
Conclusion
EURUSD has shifted from a bullish to a bearish near-term posture since the June review. The pair has fallen from 1.1630 to 1.1450, crossing EMA65 and EMA200 on the daily chart after a June crossover, and is now testing the lower Bollinger Band on the weekly. The weekly MACD has moved below zero — confirming that intermediate-term selling pressure is now dominant. The active scenario is bearish: while price consolidates between 1.1280 and 1.1500, the next directional move is more likely to be downward. A confirmed weekly close below 1.1280 would signal the start of the next downward wave toward 1.1080 and 1.1000.
The fundamental picture reinforces the near-term bearish bias. The ECB raised its rate to 2.40% at the June meeting, but the Fed is holding at 3.75% — a 135 bp differential that continues to favour USD-denominated assets. US inflation (3.5%) remains above eurozone CPI (2.8%), and US GDP growth (2.1%) continues to outpace the eurozone (0.8%). The upcoming July 22–23 ECB meeting and July 28–29 FOMC meeting are the key catalysts that could shift the picture: a hawkish ECB combined with a dovish Fed signal would be the most euro-positive combination. The institutional consensus for year-end 2026 remains broadly bullish (1.2000–1.3000), but the near-term path to those targets runs through a period of further USD strength and EURUSD consolidation.
FAQ
What is the EURUSD forecast for the next week?
EURUSD is currently trading near 1.1450. A confirmed close above 1.1500 would signal buyer strength and open the path toward 1.1805. If sellers prevail, a decline toward the 1.1280 support is the next downside target, with 1.1080 as the subsequent level in the bearish scenario. The near-term bias is bearish while price remains below 1.1500.
What are the key support and resistance levels for EURUSD?
Key resistance levels: 1.1500 (psychological round level — near-term key resistance), 1.1805 (upper Bollinger Band — strong historical rejection zone), 1.1915 (swing high reversal zone). Key support levels: 1.1450 (current pivot at lower Bollinger Band), 1.1280 (former resistance broken on third attempt — critical level; close below signals bearish continuation), 1.1080 (key structural support), 1.1000 (psychological round number). See the Key Price Levels table for the complete picture.
Is EURUSD bullish or bearish right now?
The intermediate-term structure is bearish: EURUSD has crossed EMA65 and EMA200 to the downside on the daily chart (June 2026 crossover), and the weekly MACD has moved below zero. Price near 1.1450 is in a sideways range between 1.1400 and 1.1500, with bulls and bears in equilibrium. The active scenario is bearish — a close below 1.1280 confirms the next downward wave. A close above 1.1500 is required to restore the bullish bias.
Will EURUSD reach 1.2000?
A confirmed breakout above 1.1805 and continuation toward 1.1915 would put 1.2000 within reach. The institutional consensus broadly supports this scenario for year-end 2026: UBS targets 1.2000 by December, Bank of America 1.2200, Deutsche Bank 1.2500 and Morgan Stanley 1.3000. The primary conditions are a softening in Fed rhetoric at the July 28–29 FOMC meeting and a continued narrowing of the US–eurozone inflation differential. Citi Research maintains the bear case at 1.1000.
What drives the EURUSD exchange rate?
EURUSD is driven by the relative economic performance of the US and Eurozone. Key factors are the ECB vs Fed policy divergence (interest rate differential), inflation differentials between the two regions, GDP growth gap, the US Dollar Index (DXY), capital flows, and geopolitical risk. When the US economy outperforms or the Fed is more hawkish than the ECB, the dollar tends to strengthen and EURUSD falls. The reverse is also true.
How does the Federal Reserve interest rate affect EURUSD?
Higher Federal Reserve interest rates increase the yield on US dollar-denominated assets, attracting capital into USD. This strengthens the dollar relative to the euro and pushes EURUSD lower. Conversely, when the Fed cuts rates or signals easing, dollar attractiveness decreases and the euro tends to appreciate. The current 135 basis point differential between the Fed rate (3.75%) and the ECB rate (2.40%) is a key factor supporting USD and limiting EURUSD upside.
What is the EURUSD forecast for 2026?
The institutional consensus is broadly bullish for year-end 2026, with targets ranging from 1.2000 (UBS) to 1.3000 (Morgan Stanley). RoboForex Analysis Department places the 2026 range at 1.1000–1.3000 with a neutral near-term and bullish long-term bias. A breakout above 1.1915 would confirm the bullish case. Citi Research is the exception, targeting 1.1000 by year-end. The July ECB and FOMC meetings are the next major catalysts that could shift this picture.
How is the EURUSD forecast on this page prepared?
This forecast is prepared using technical analysis across the Daily, H4 and Weekly timeframes — MA 65/200, RSI 14, MACD 12/26/9 and Stochastic 20/15/15 — combined with fundamental drivers (ECB and Fed policy, inflation and GDP differentials, DXY and geopolitics) and published forecasts from major investment banks. The article is reviewed and updated periodically by RoboForex Analysis Department.
What is EURUSD?
EURUSD is the exchange rate between the euro and the US dollar, showing how many US dollars one euro buys. If EURUSD is at 1.1450, it means 1 euro equals 1.1450 US dollars. It is the most actively traded currency pair in the world, accounting for approximately 20–25% of global daily forex turnover, and serves as the primary benchmark for dollar strength or weakness.
Forecasts presented in this section only reflect the author’s private opinion and should not be considered as guidance for trading. RoboForex bears no responsibility for trading results based on trading recommendations described in these analytical reviews.