
US 30 index forecast: US 30 tests the 53,800.0 support level and risks further decline
The US 30 remains under pressure ahead of the release of US inflation data. A breakout below the 53,800.0 support level could push the index further down, opening the way towards 52,900.0.
US 30 forecast: key takeaways
- Recent data: US inflation remains elevated, while the Federal Reserve maintains a hawkish stance
- Market impact: high inflation increases the risk of further Federal Reserve policy tightening and puts pressure on US 30
US 30 fundamental analysis
The US 30 fundamental analysis for 12 August 2026 points to increasing downside risks for the index. Over the past two trading sessions, the Dow Jones has pulled back from all-time highs, as investors reduce risk ahead of the US inflation data release.
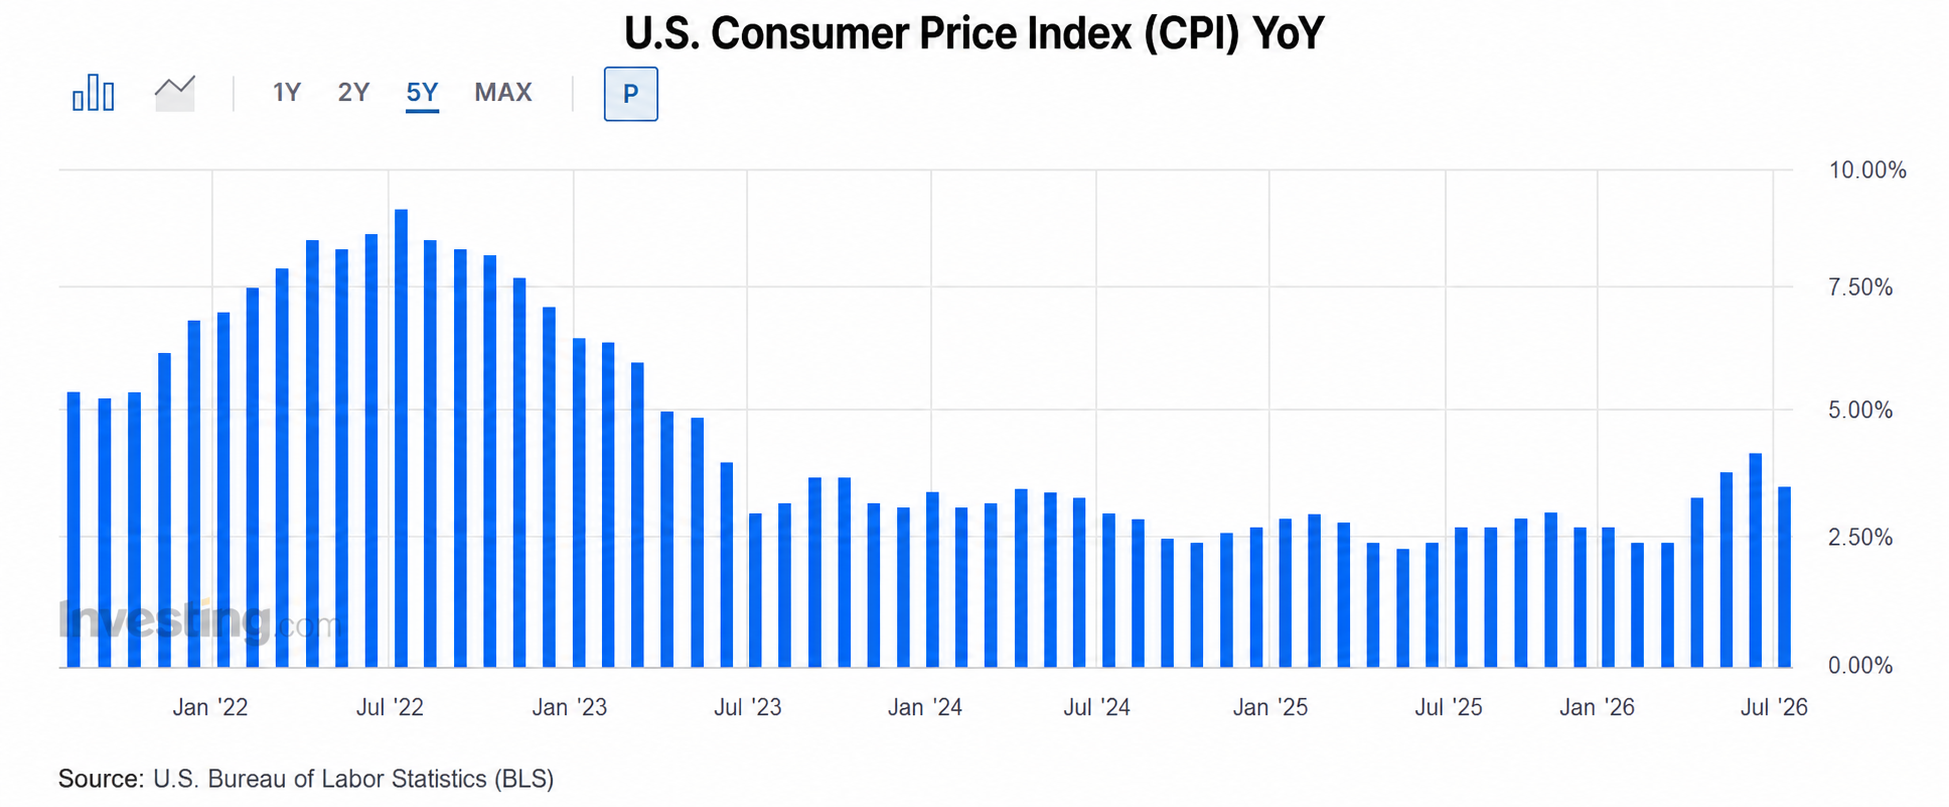
The key event of the day will be the July CPI report. Inflation remains relatively high, so a stronger-than-expected reading would fuel expectations of a Federal Reserve rate hike and could increase pressure on the US stock market. Large company stocks included in the US 30 remain particularly sensitive to this scenario.
The US 30 forecast for 12 August remains moderately negative. Persistently high inflation and the Federal Reserve’s hawkish stance create conditions for the correction to continue, while a weaker CPI reading would be the main risk to the bearish scenario for the index.
US 30 technical analysis
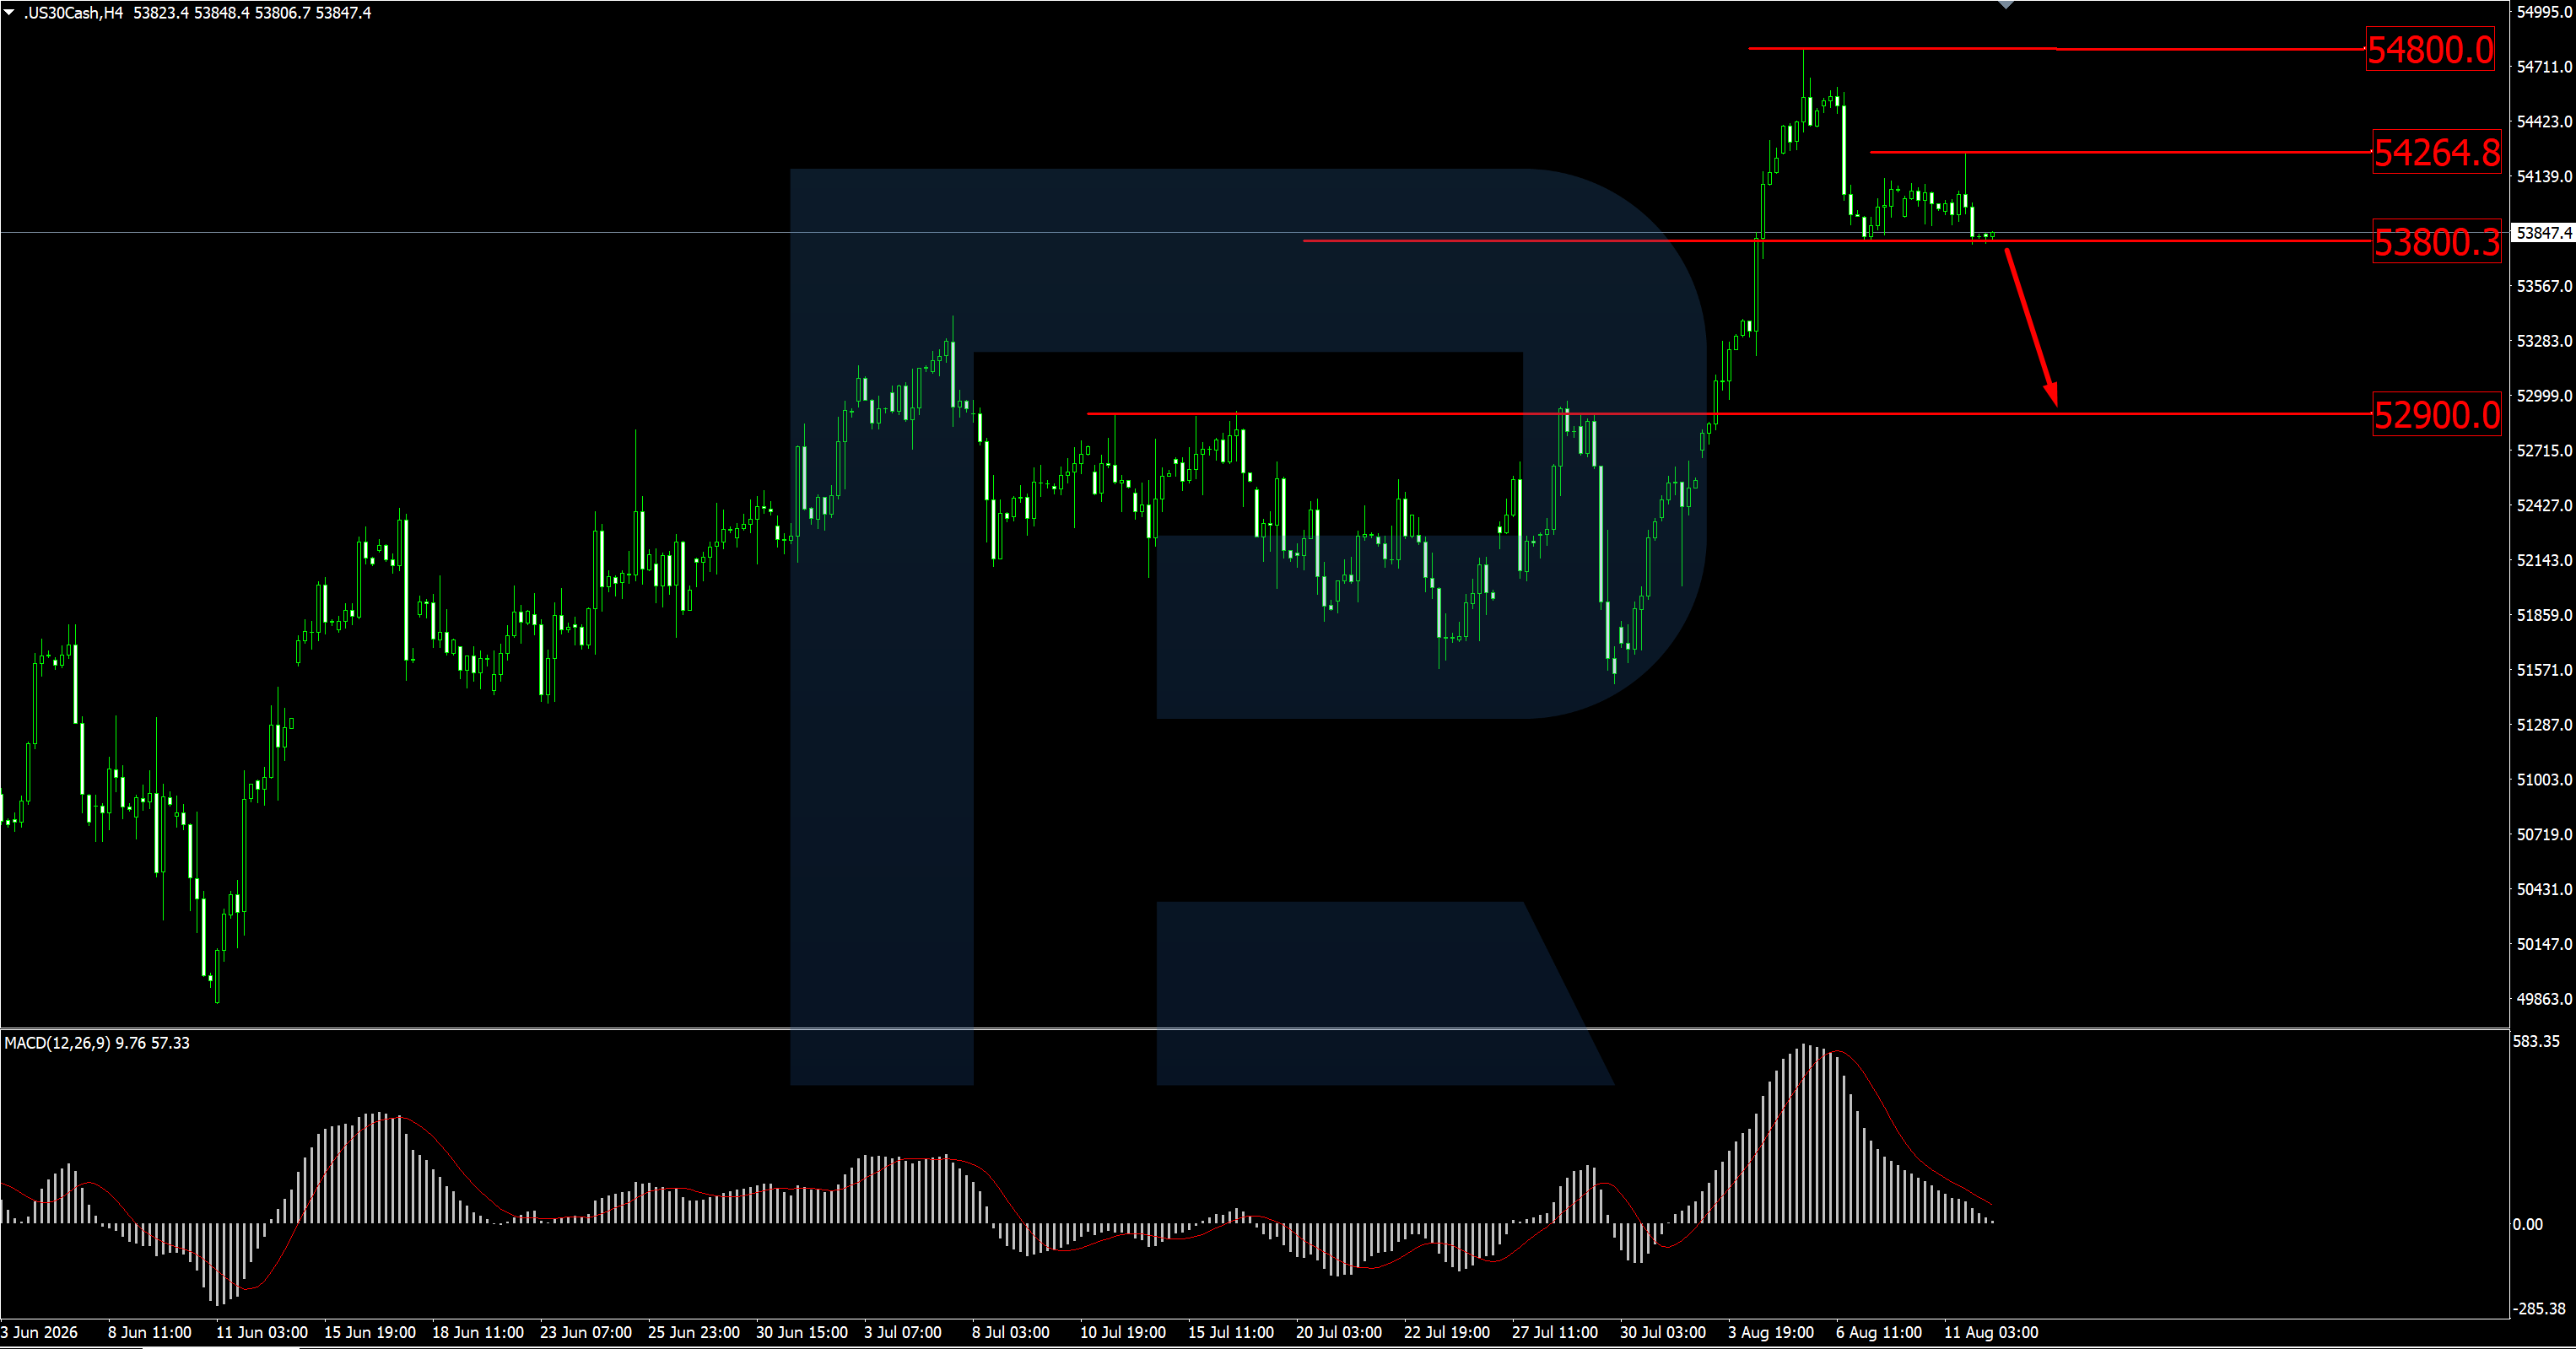
On the H4 timeframe, the US 30 is testing the 53,800.0 support level. The MACD indicator has fallen towards the zero line, signalling a potential shift from an uptrend to a downtrend. If US inflation comes in high, the US 30 index could break below the 53,800.0 support level, while MACD could move into negative territory. In this case, the index could continue to decline towards the next support level at 52,900.0 USD.
The US 30 price forecast outlines the following scenarios:
- Pessimistic US 30 scenario: a breakout below the 53,800.0 support level could push the index down to 52,900.0
- Optimistic US 30 scenario: a rebound from the 53,800.0 support level could act as a catalyst for a rise towards the 54,800.0 resistance level.
Summary
The US 30 remains at risk of further decline amid elevated US inflation and the Federal Reserve’s hawkish stance. The technical picture also indicates weakening buying pressure: the index is testing the 53,800.0 support level, while MACD is approaching negative territory. A breakout below this mark could confirm a short-term trend reversal and open the door for a decline towards 52,900.0. At the same time, weaker inflation data could support the market and trigger a rebound in the US 30 from 53,800.0, followed by a recovery towards the 54,800.0 resistance level.
Editors’ picks

EURUSD forecast 2026–2027: technical analysis, price levels & predictions
EURUSD has pulled back from the 2026 high of 1.1915 and is now trading near 1.1450 — below both EMA65 and EMA200 — with the active scenario shifting from bullish to bearish. The ECB raised rates to 2.40%, but the Fed holds at 3.75%, and US inflation (3.5%) continues to outpace the eurozone (2.8%). A confirmed break below 1.1280 opens the next downward wave toward 1.1080. We break down the key levels, three trading scenarios with entry triggers, and what Deutsche Bank, Morgan Stanley and UBS are forecasting for EURUSD in 2026.

Gold (XAUUSD) forecast 2026: predictions based on fundamental and technical analysis
Gold has corrected over 25% from its all-time high of 5,597 USD and is now trading near 4,100 USD — testing a critical support zone. Is this the bottom, or will the downtrend continue? We break down the key levels (support 3,920 USD, breakout trigger 4,500 USD), three trading scenarios with entry levels, and what J.P. Morgan, Goldman Sachs and Deutsche Bank are forecasting for gold in 2026.
Ang mga pagtataya na ipinakita sa seksyong ito ay nagpapakita lamang ng pribadong opinyon ng may-akda at hindi dapat ituring bilang gabay para sa pagtetrade. Walang pananagutan ang RoboForex para sa mga resulta ng pagtetrade batay sa mga rekomendasyon sa pagtetrade na inilarawan sa mga analytical review na ito.