
US 30 correction nears completion as a strong labour market gives the Fed no reason to cut rates
Today’s US 30 forecast is unfavourable for the index, which continues to lose ground amid rising US bond yields. The current US 30 quote is 52,577.0.
US 30 forecast: key takeaways
- August NFP came in at 162 thousand, above the forecast
- US unemployment remained unchanged at 4.1%
- The market will await US inflation data on Friday
- US 30 forecast for 9 September 2026: 51,530.0
US 30 fundamental analysis
The published US labour market data was significantly stronger than expected overall, with Nonfarm Payrolls rising by 162 thousand in August, above a forecast of around 55 thousand – 56 thousand and the upwardly revised gain of 21 thousand in July. Unemployment remained at 4.1%, while average hourly earnings rose by 0.3% month-on-month. On an annual basis, wage growth was 3.1%. In addition, the June and July figures were revised upwards by a combined 55 thousand jobs. The report therefore points to a notable recovery in the pace of job creation, while at the same time showing no acceleration in wage growth.
For the US 30, the report can be assessed as moderately negative in the short term despite the strong economic figures. The market reaction has already illustrated this pattern: following the strong employment report, the Dow Jones fell by around 0.5%, while government bond yields rose and the US dollar strengthened. This indicates that investors are currently paying more attention to the risk of further Federal Reserve tightening than to the positive impact of strong employment on economic growth.
US 30 technical analysis
On the H4 chart, the US 30 has broken below the 52,705.0 support level, while resistance has formed at 53,125.0. The broader trend remains upward. On the D1 chart, a resistance level has formed at 57,875.0, with support at 51,530.0. On the H4 chart, quotes may form a short-term sideways trend. The first downside target is 51,530.0.
At the same time, the US 30 forecast also considers an alternative scenario in which quotes could break above 53,125.0 and move towards 54,870.0 before the uptrend continues.
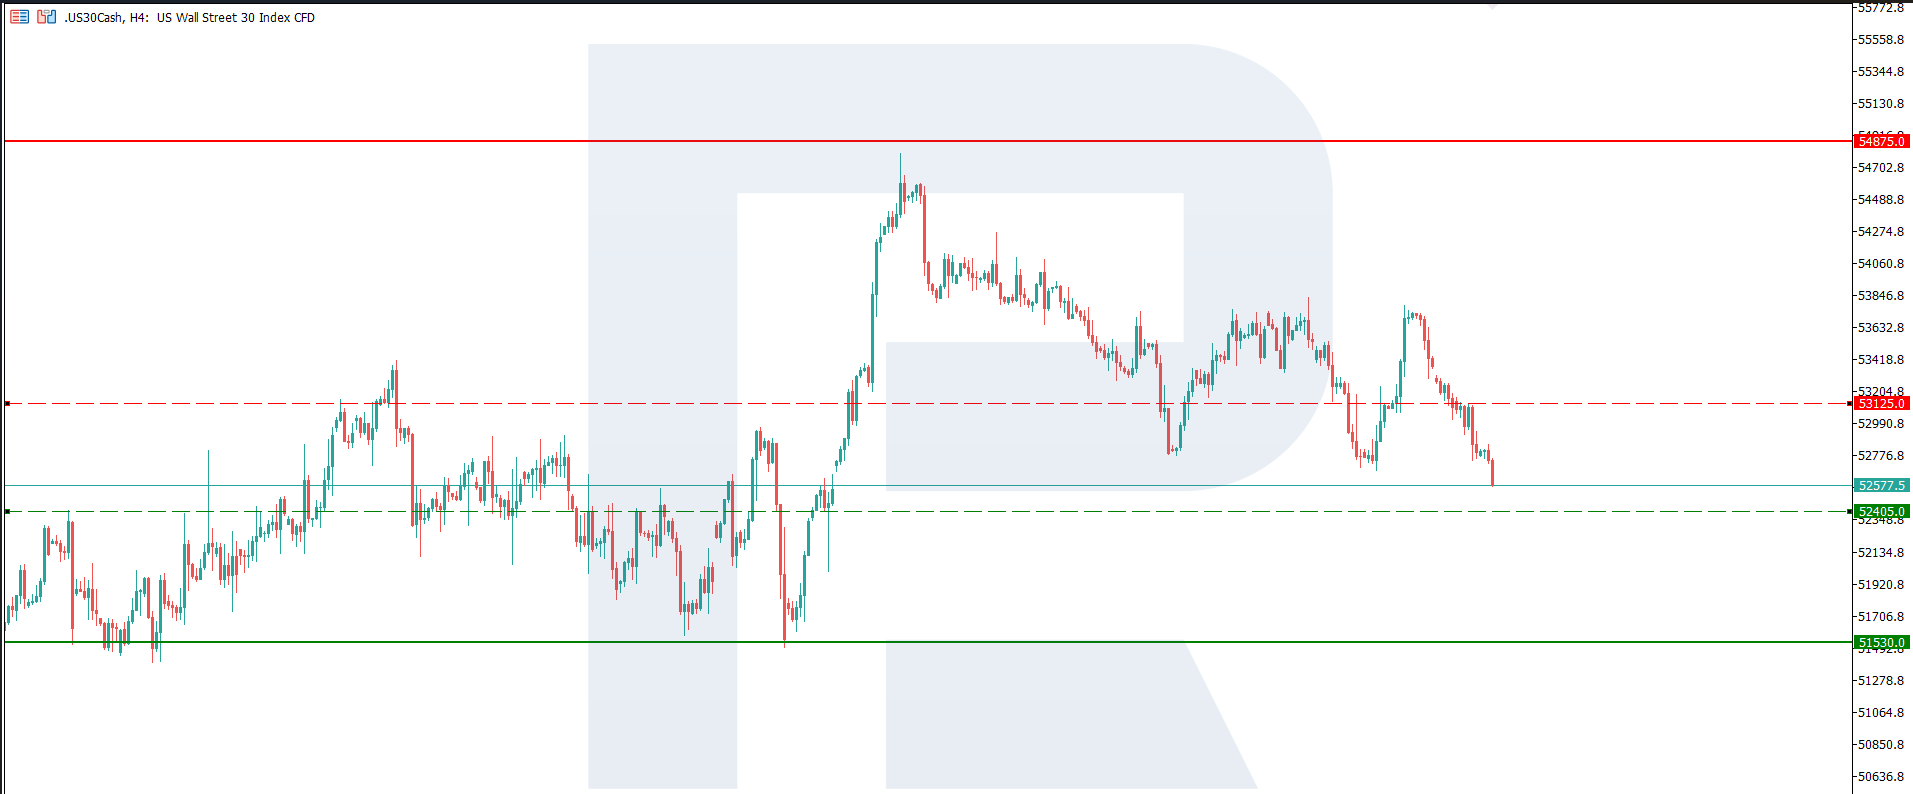
US 30 trading scenario for today
Trading scenario (Sell Stop)
A consolidation below the 52,705.0 support level would confirm continued downward movement and create conditions for opening short positions in the US 30.
- Current price: 52,577.0
- Entry level: 52,400.0
- Take profit: 51,530.0
- Stop loss: 52,500.0
- Risk-to-reward ratio: 1:8.7
The trade idea is valid until 8:00 AM on 16 September 2026 (server time, UTC+3).
Risk factors
The main risk factors for the US 30 are linked to a further rise in Treasury yields and a potential shift in Federal Reserve policy expectations towards keeping interest rates high for longer. A strong labour market reduces the likelihood of near-term monetary easing; combined with persistent inflationary pressure, this could push stock prices lower, particularly in rate-sensitive sectors. Additional risks include higher borrowing costs for businesses and consumers, a possible slowdown in corporate investment, tighter financial conditions and weaker consumer demand in the coming months.
Summary
The labour market report creates a mixed fundamental backdrop for the US 30. On the one hand, job growth of 162 thousand, well above expectations of around 55 thousand, stable unemployment and moderate wage growth confirm the resilience of the US economy and reduce the likelihood of a recession. On the other hand, such robust data increases the likelihood that the Federal Reserve will maintain a hawkish policy stance and support higher government bond yields.
Editors’ picks

EURUSD forecast 2026–2027: technical analysis, price levels & predictions
EURUSD has recovered from the July lows and is trading near 1.1545 — back in bullish territory. The pair has reclaimed EMA65 on the daily, formed a bullish EMA crossover on H4, and the US-eurozone GDP gap has narrowed sharply (US 1.5% vs eurozone 1.0%). Goldman Sachs and Deutsche Bank both now target 1.2500 by year-end. A confirmed close above 1.1700 opens the path to 1.1805. We break down the key levels, three trading scenarios, and what the unprecedented 9-3 FOMC dissent vote means for EURUSD.

Gold (XAUUSD) forecast 2026: technical analysis, price levels & predictions
Gold has reversed its downtrend and is trading near 4,360 USD, back above both EMA65 and EMA200. ETF flows turned positive in July with 3 billion USD of net inflows, and central banks bought 288.9 tonnes in Q2 — up 62% year-on-year. A breakout above 4,500 USD opens the path to 4,855 USD and the 5,597 USD all-time high. We break down the key levels, three trading scenarios with entry triggers, and what J.P. Morgan, Deutsche Bank and Goldman Sachs are forecasting for gold in 2026.
Ang mga pagtataya na ipinakita sa seksyong ito ay nagpapakita lamang ng pribadong opinyon ng may-akda at hindi dapat ituring bilang gabay para sa pagtetrade. Walang pananagutan ang RoboForex para sa mga resulta ng pagtetrade batay sa mga rekomendasyon sa pagtetrade na inilarawan sa mga analytical review na ito.