
US 500 forecast: the index enters a sideways channel
The US 500 index is forming a sideways channel following a correction. The US 500 forecast for today is positive.
US 500 forecast: key takeaways
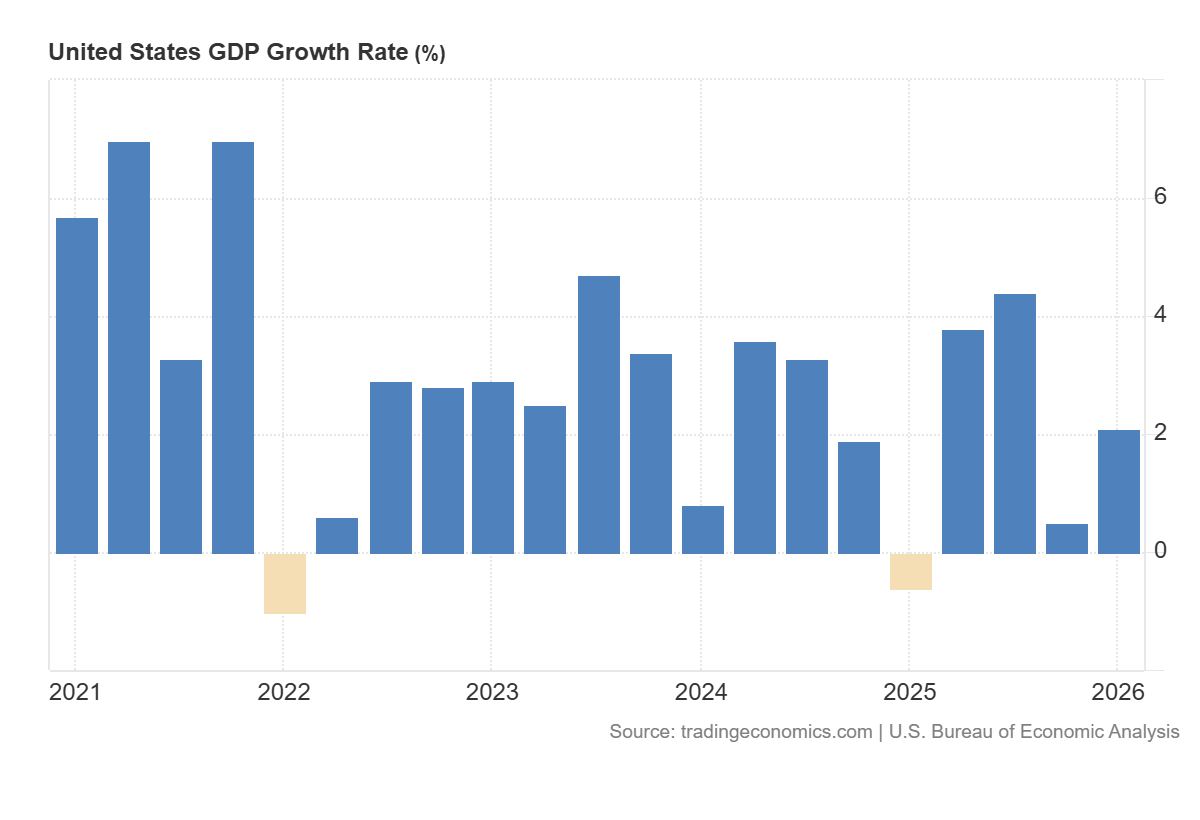
- Recent data: US GDP grew by 2.1% in Q1 2026
- Market impact: this data has a moderately positive impact on the stock market
US 500 fundamental analysis
Stronger-than-expected US GDP data may be interpreted by the market as a signal that the US economy remains more resilient. Growth of 2.1%, compared to the forecast of 1.6% and the previous reading of 0.5%, indicates a notable acceleration in economic activity. For the US 500 index, such data is generally moderately positive, as strong GDP means corporate revenue and earnings may remain stable, while the risk of a sharp economic slowdown declines.
The US 500 index reaction will not necessarily be clearly positive. Robust macroeconomic data may fuel expectations that the US Federal Reserve will take a more cautious approach to interest rate cuts or maintain a tight monetary stance for longer than the market previously expected. This is an important factor for stocks, as higher rates reduce the appeal of highly valued companies and increase borrowing costs for businesses. Therefore, the initial market reaction may be mixed: on the one hand, investors receive confirmation of economic strength; on the other hand, the risk of a longer period of high borrowing costs increases.
US 500 technical analysis
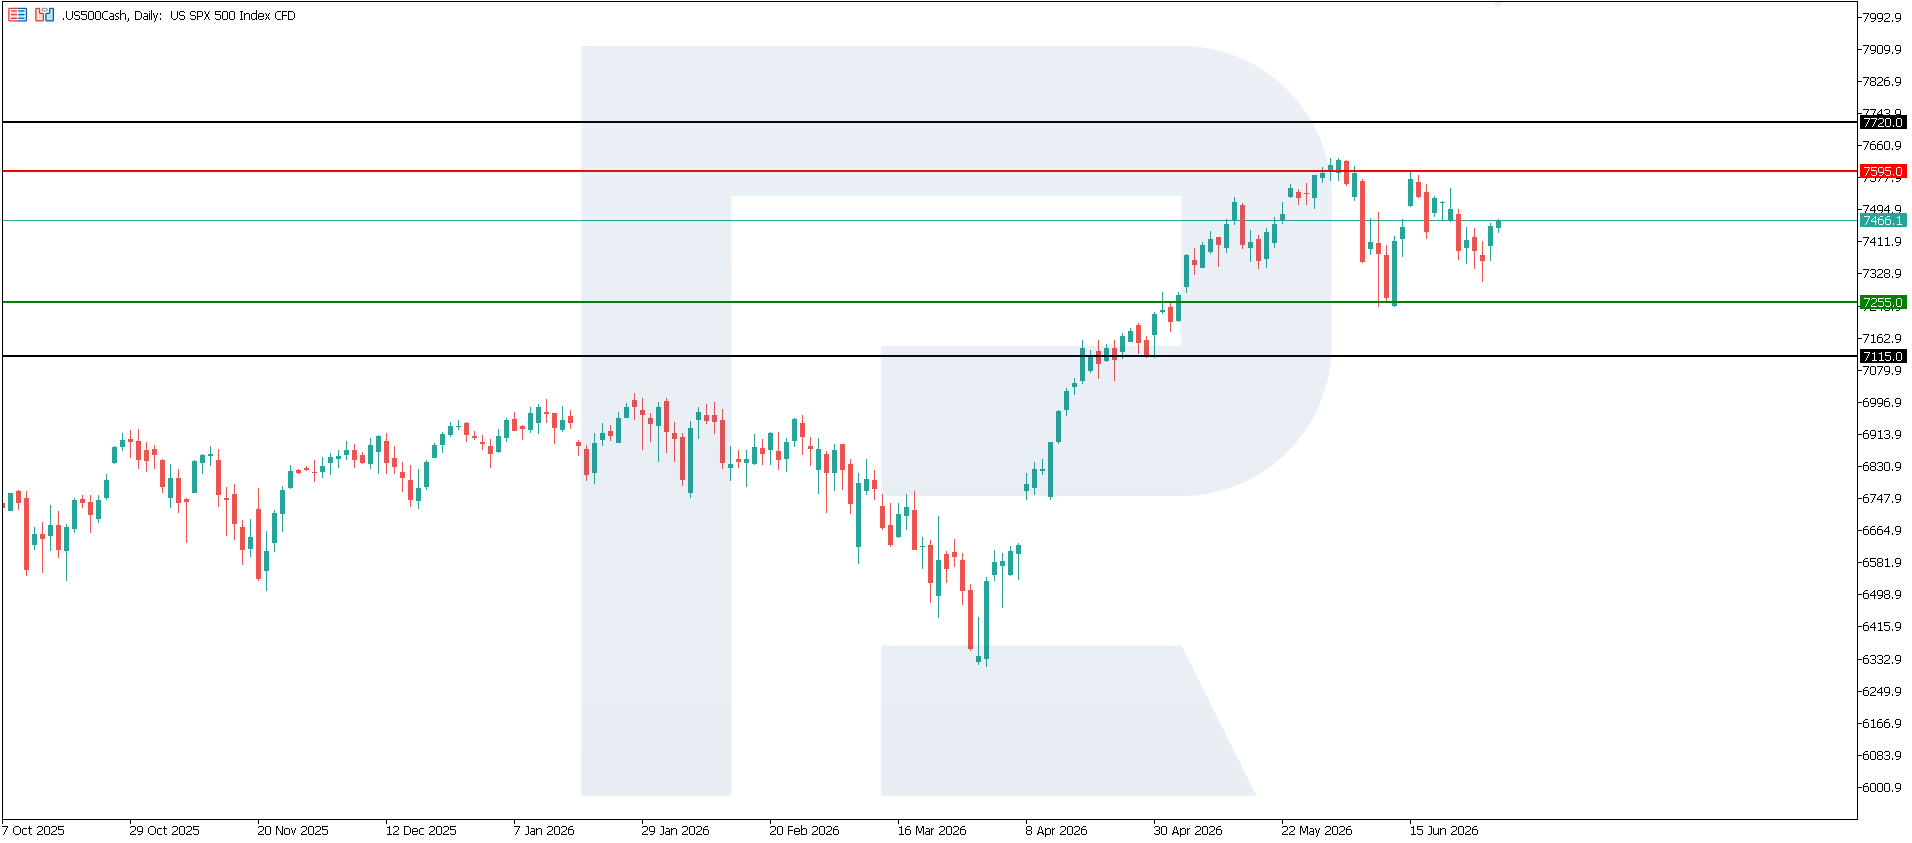
The US 500 index has completed its correction, but growth has not resumed, and the likelihood of a sideways channel forming is increasing. The resistance level is located at 7,595.0, with the key support level at 7,255.0. If the trend continues, the nearest upside target could be 7,720.0.
The US 500 price forecast outlines the following scenarios:
- Pessimistic US 500 forecast: a breakout below the 7,255.0 support level could send the index down to 7,115.0
- Optimistic US 500 forecast: a breakout above the 7,595.0 resistance level could boost the index up to 7,720.0
Summary
The publication showing stronger US GDP growth is favourable for assessing the state of the economy and may support the US 500 in the medium term. However, the short-term reaction will depend on how the market revises expectations for Federal Reserve rates. If investors conclude that the economy is growing without a significant increase in inflation, the US 500 index may receive additional support. If the data is interpreted as a reason for tighter Fed policy, index growth could be limited, and some overvalued sectors may face profit-taking. From a technical perspective, the US 500 index could rise to 7,720.0.
Editors’ picks

EURUSD forecast 2026–2027: technical analysis, price levels & predictions
The ECB holds rates at 2.15% while the Fed stays at 3.75% — and that divergence is the central driver of EURUSD in 2026. The pair is range-bound between 1.1400 and 1.1915, with Deutsche Bank targeting 1.2500 and Morgan Stanley calling for 1.3000 by year-end. We analyse the technicals, break down the macro factors, and outline three trading scenarios with specific entry levels.

Gold (XAUUSD) forecast 2026: predictions based on fundamental and technical analysis
Where is gold headed after pulling back from the all-time high of 5,597 USD? XAUUSD is consolidating near 4,518 USD between key levels 4,220 USD and 4,855 USD, with major banks targeting 5,243–6,200 USD by year-end. Read our comprehensive gold forecast: technical analysis across three timeframes, trading scenarios with specific entry levels, Fed policy and central bank demand outlook, and institutional predictions for 2026 and beyond.
Ang mga pagtataya na ipinakita sa seksyong ito ay nagpapakita lamang ng pribadong opinyon ng may-akda at hindi dapat ituring bilang gabay para sa pagtetrade. Walang pananagutan ang RoboForex para sa mga resulta ng pagtetrade batay sa mga rekomendasyon sa pagtetrade na inilarawan sa mga analytical review na ito.