
US 500 forecast: index approaches upper channel boundary
The US 500 index is testing the resistance level again. A breakout could resume the uptrend. The US 500 forecast for today is positive.
US 500 forecast: key takeaways
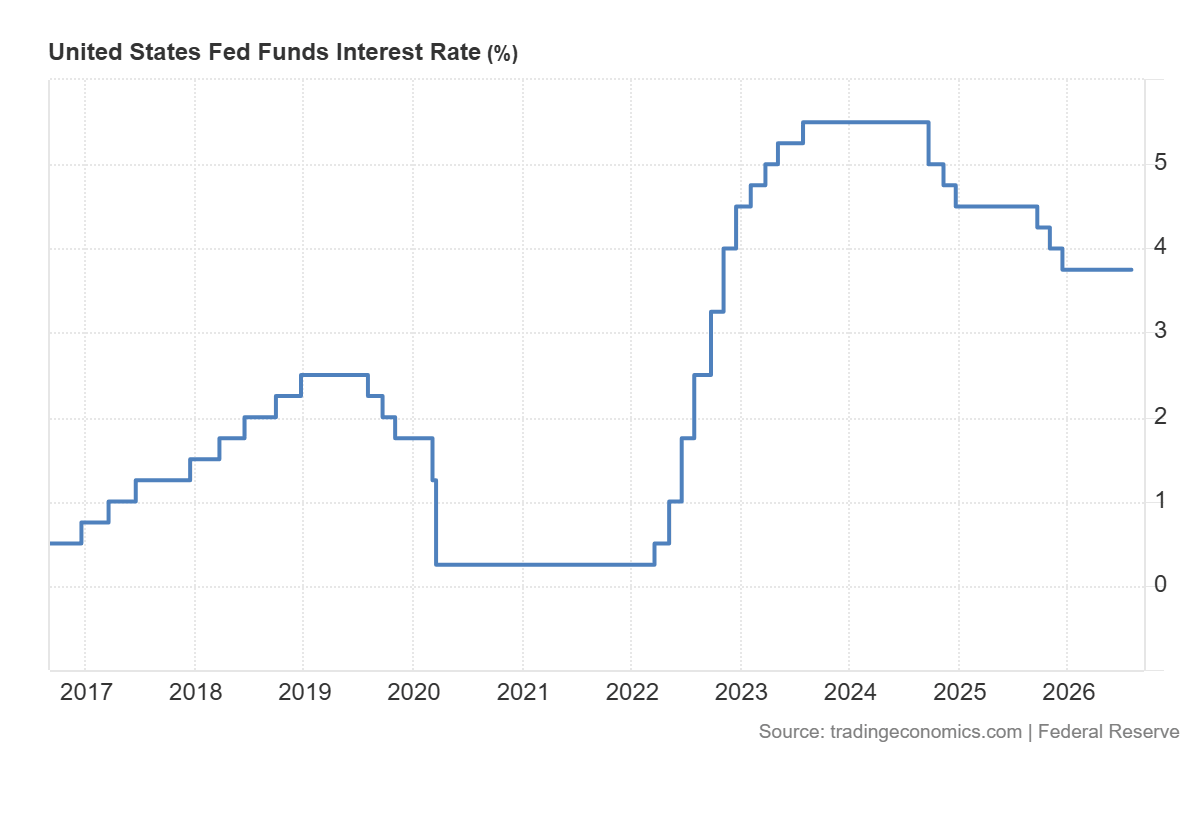
- Recent data: the US Federal Reserve held its interest rate steady at 3.75%
- Market impact: the data is moderately positive for the stock market
US 500 fundamental analysis
The Federal Reserve’s decision to keep the interest rate within the 3.50–3.75% range was not a surprise to the market. However, the statement and the Federal Reserve chairman’s comments were far more important than the decision to leave the rate unchanged. The decision was approved by nine votes to three, with three Committee members supporting a 0.25 percentage point rate hike. At the same time, the Fed noted the economy’s steady growth, stable labour market conditions, and persistent inflation above the 2% target. This indicates growing disagreement within the Federal Reserve over whether the current interest rate level is sufficient to return inflation to the target.
For the US 500 index, the news is primarily negative in the short term. Initially, keeping the rate unchanged could have been viewed positively, as the regulator refrained from immediately raising borrowing costs further. However, subsequent statements effectively ruled out interpreting the decision as the beginning of monetary policy easing. The Federal Reserve chairman emphasised that the decision to hold rates steady was only the beginning of the next stage of the process, rather than its completion.
US 500 technical analysis
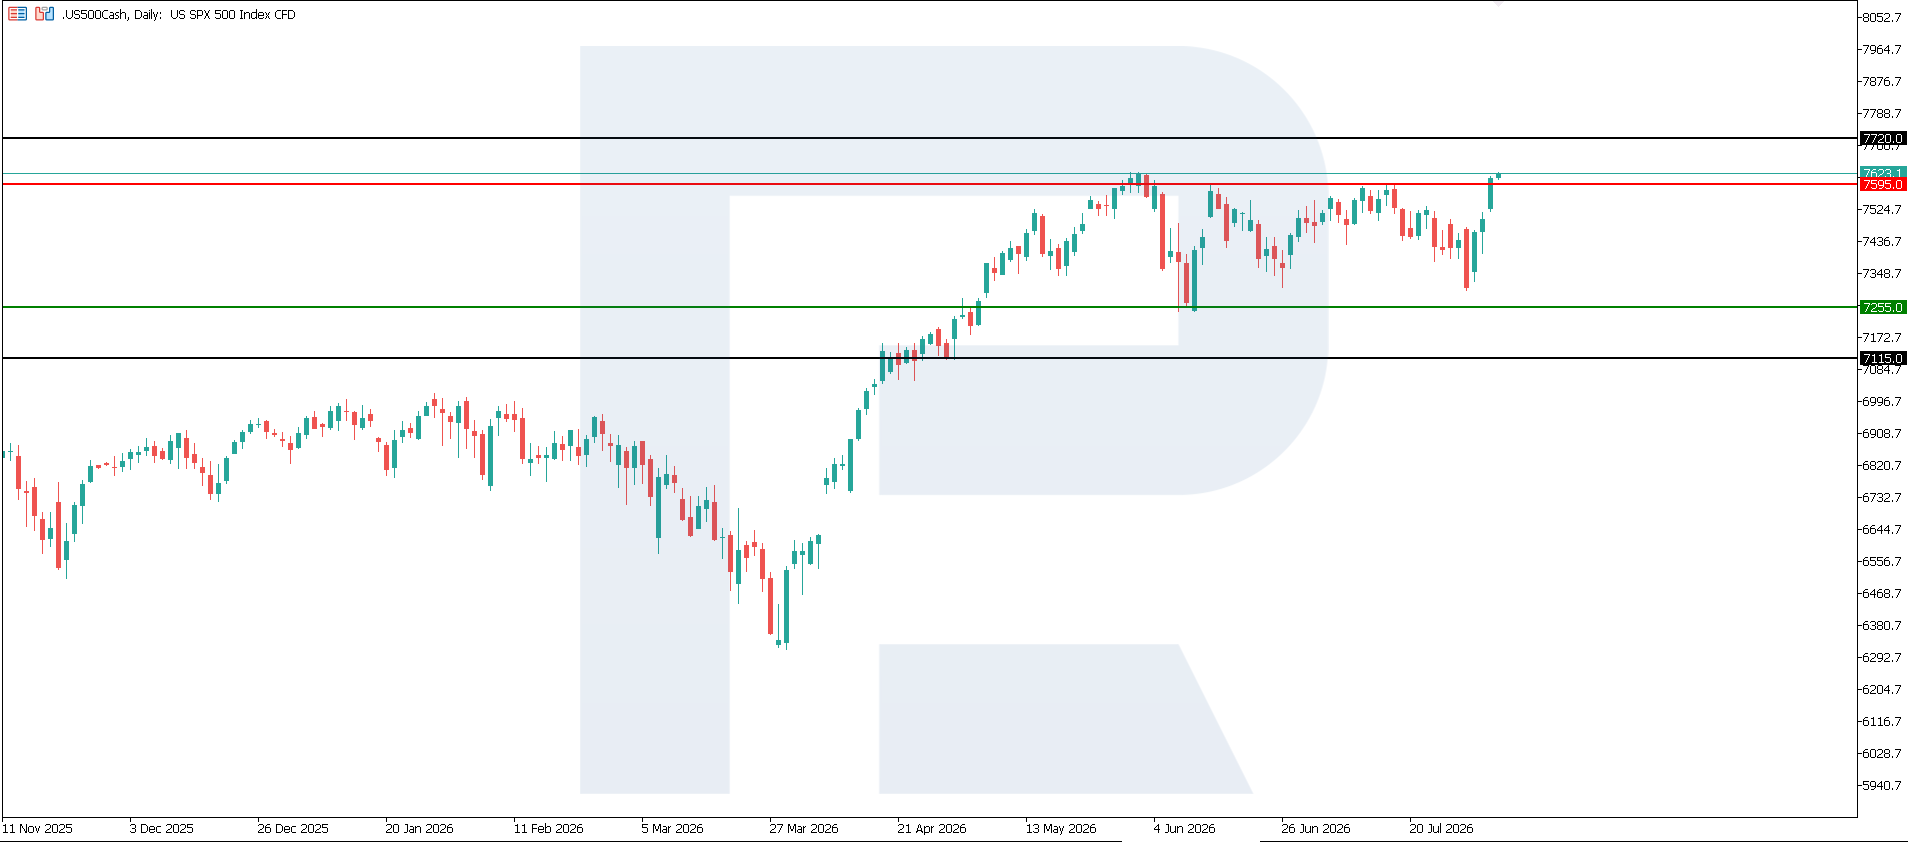
The corrective decline in the US 500 index is likely gradually losing momentum, although there is still insufficient evidence to suggest a full recovery in the upward movement. In the near term, the index may move sideways and continue to trade within the established range. The nearest resistance level is located at 7,595.0, with the key support level at 7,255.0. If demand strengthens and the index consolidates above the resistance level, the next upside target could be 7,720.0.
The US 500 price forecast outlines the following scenarios:
- Pessimistic US 500 scenario: a breakout below the 7,255.0 support level could send the index down to 7,115.0
- Optimistic US 500 scenario: a breakout above the 7,595.0 resistance level could drive the index up to 7,720.0
Summary
Overall, the Federal Reserve chairman’s comments increase uncertainty and create moderately negative conditions for the US 500. The regulator did not announce that a rate hike was inevitable, but made it clear that this possibility remains real and will depend on future inflation dynamics. The baseline scenario for the index is a period of heightened volatility without sustained growth until more convincing data on price pressures emerges. A sustained slowdown in inflation could restore interest in stocks and support a recovery in the US 500. From a technical perspective, the US 500 index could rise to 7,720.0.
Editors’ picks

EURUSD forecast 2026–2027: technical analysis, price levels & predictions
EURUSD has pulled back from the 2026 high of 1.1915 and is now trading near 1.1450 — below both EMA65 and EMA200 — with the active scenario shifting from bullish to bearish. The ECB raised rates to 2.40%, but the Fed holds at 3.75%, and US inflation (3.5%) continues to outpace the eurozone (2.8%). A confirmed break below 1.1280 opens the next downward wave toward 1.1080. We break down the key levels, three trading scenarios with entry triggers, and what Deutsche Bank, Morgan Stanley and UBS are forecasting for EURUSD in 2026.

Gold (XAUUSD) forecast 2026: predictions based on fundamental and technical analysis
Gold has corrected over 25% from its all-time high of 5,597 USD and is now trading near 4,100 USD — testing a critical support zone. Is this the bottom, or will the downtrend continue? We break down the key levels (support 3,920 USD, breakout trigger 4,500 USD), three trading scenarios with entry levels, and what J.P. Morgan, Goldman Sachs and Deutsche Bank are forecasting for gold in 2026.
Ang mga pagtataya na ipinakita sa seksyong ito ay nagpapakita lamang ng pribadong opinyon ng may-akda at hindi dapat ituring bilang gabay para sa pagtetrade. Walang pananagutan ang RoboForex para sa mga resulta ng pagtetrade batay sa mga rekomendasyon sa pagtetrade na inilarawan sa mga analytical review na ito.