
US 500: oil, bonds, and the Federal Reserve rate
The US 500 index has stabilised following the US market decline earlier in the week, but pressure from the technology sector, high oil prices, and rising yields persists. The price currently stands at 7,622.
US 500 forecast: key takeaways
- The semiconductor sector saw increased selling following new warnings about the risks of rapid artificial intelligence development
- The likelihood of a 25-basis-point Federal Reserve rate hike on Wednesday stands at 92%, while high oil prices and rising yields are adding further pressure on stocks
- US 500 forecast for 15 September 2026: 7,615 and 7,575
US 500 fundamental analysis
US stock index futures stabilised on Tuesday after the major indices declined at the start of the week. On Monday, the Nasdaq Composite lost 0.56%, the S&P 500 fell by 0.48%, and the Dow Jones declined by 0.29%. The technology sector came under the greatest pressure.
Investor sentiment deteriorated after Anthropic CEO Dario Amodei called for a slowdown in the pace of artificial intelligence development due to risks associated with the continued expansion of model capabilities. OpenAI CEO Sam Altman and xAI CEO Elon Musk supported this position, reinforcing market caution towards AI-related companies.
Semiconductor manufacturers posted the most notable declines. NVIDIA shares lost 3.4%, Micron 5.3%, Sandisk 5%, AMD 4.4%, and Intel 5.6%. Selling in the largest technology companies is putting noticeable pressure on the S&P 500 due to their high weighting in the index.
High oil prices and rising US Treasury yields remain additional risk factors. The market estimates the likelihood of a 25-basis-point Federal Reserve rate hike on Wednesday at around 92%. Ahead of the central bank meeting, investors remain cautious, as hawkish signals about the future rate trajectory could weigh on the stock market.
The US 500 outlook is neutral.
US 500 technical analysis
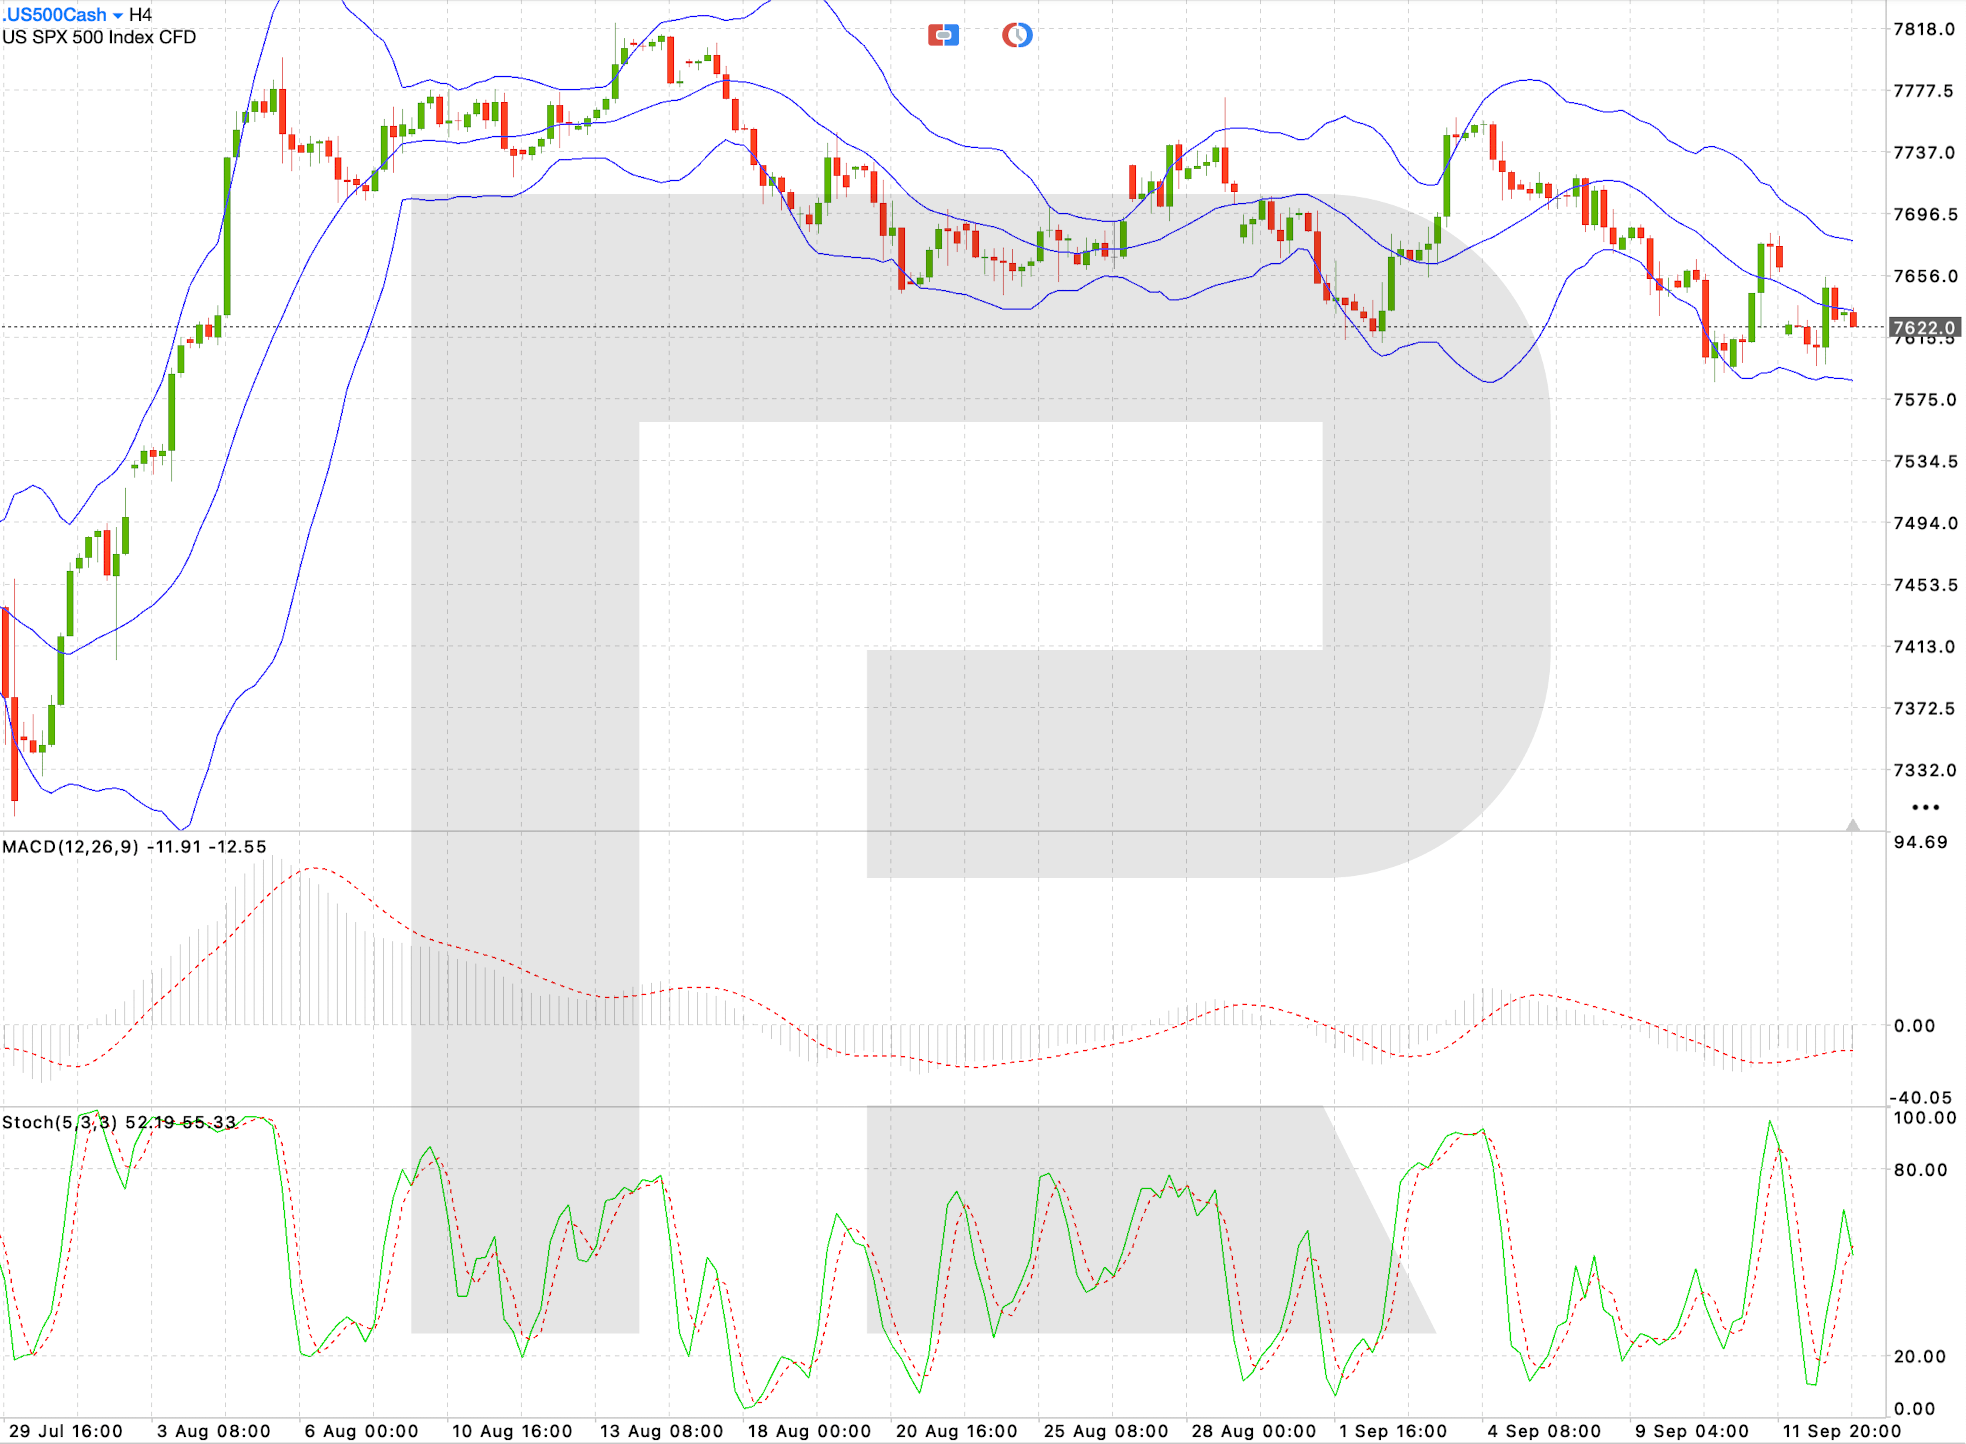
On the H4 timeframe, the US 500 confirms a moderately bearish structure following several failed attempts to return to the September highs. The price is hovering below the middle Bollinger Band and consolidating in the lower part of the range, keeping the advantage with the sellers.
MACD remains below zero, although the indicator line has moved slightly above the signal line, indicating weakening bearish momentum. This increases the likelihood of short-term consolidation or a technical rebound. The Stochastic Oscillator is in neutral territory near the 50-point mark, so there is still no sustained recovery signal.
The nearest support level is located at 7,615. A consolidation below this mark could renew pressure on the index and open the way towards 7,575. A deeper decline would send the price towards 7,535. To change the short-term outlook, buyers need to push the US 500 back above the 7,656 resistance level, after which the next target would be around 7,697.
US 500 trading scenario for today
- Asset: US 500
- Timeframe: H4 (Intraday)
- Trend: bearish
- Key resistance levels: 7,656 and 7,697
- Key support levels: 7,615 and 7,575
Trading scenario (Sell Stop)
A breakout below a local support level and consolidation below 7,615 would confirm continued selling pressure and create conditions for a further decline.
- Current price: 7,622
- Entry level: 7,610
- Take profit: 7,575
- Stop loss: 7,630
- Risk-to-reward ratio: 1:1.8
The trade idea is valid until 8:00 AM on 16 September 2026 (server time, UTC+3).
Risk factors
The primary risk to the US 500 downside scenario would be a more dovish Federal Reserve stance than the market expects. Signals of a pause after the September rate hike or a decline in US Treasury yields could rapidly revive demand for stocks. Stabilisation in the technology sector and a recovery among semiconductor manufacturers would provide additional support. A return above 7,656 would weaken the current bearish scenario.
Summary
The US 500 index is consolidating after a decline but generally maintains a moderate downward bias. The US 500 forecast for today, 15 September 2026, does not rule out a further decline towards 7,615 and then 7,575.
Editors’ picks

EURUSD forecast 2026–2027: technical analysis, price levels & predictions
EURUSD has recovered from the July lows and is trading near 1.1545 — back in bullish territory. The pair has reclaimed EMA65 on the daily, formed a bullish EMA crossover on H4, and the US-eurozone GDP gap has narrowed sharply (US 1.5% vs eurozone 1.0%). Goldman Sachs and Deutsche Bank both now target 1.2500 by year-end. A confirmed close above 1.1700 opens the path to 1.1805. We break down the key levels, three trading scenarios, and what the unprecedented 9-3 FOMC dissent vote means for EURUSD.

Gold (XAUUSD) forecast 2026: technical analysis, price levels & predictions
Gold has reversed its downtrend and is trading near 4,360 USD, back above both EMA65 and EMA200. ETF flows turned positive in July with 3 billion USD of net inflows, and central banks bought 288.9 tonnes in Q2 — up 62% year-on-year. A breakout above 4,500 USD opens the path to 4,855 USD and the 5,597 USD all-time high. We break down the key levels, three trading scenarios with entry triggers, and what J.P. Morgan, Deutsche Bank and Goldman Sachs are forecasting for gold in 2026.
Ang mga pagtataya na ipinakita sa seksyong ito ay nagpapakita lamang ng pribadong opinyon ng may-akda at hindi dapat ituring bilang gabay para sa pagtetrade. Walang pananagutan ang RoboForex para sa mga resulta ng pagtetrade batay sa mga rekomendasyon sa pagtetrade na inilarawan sa mga analytical review na ito.