
Moderately bullish momentum in US Tech faces strong resistance
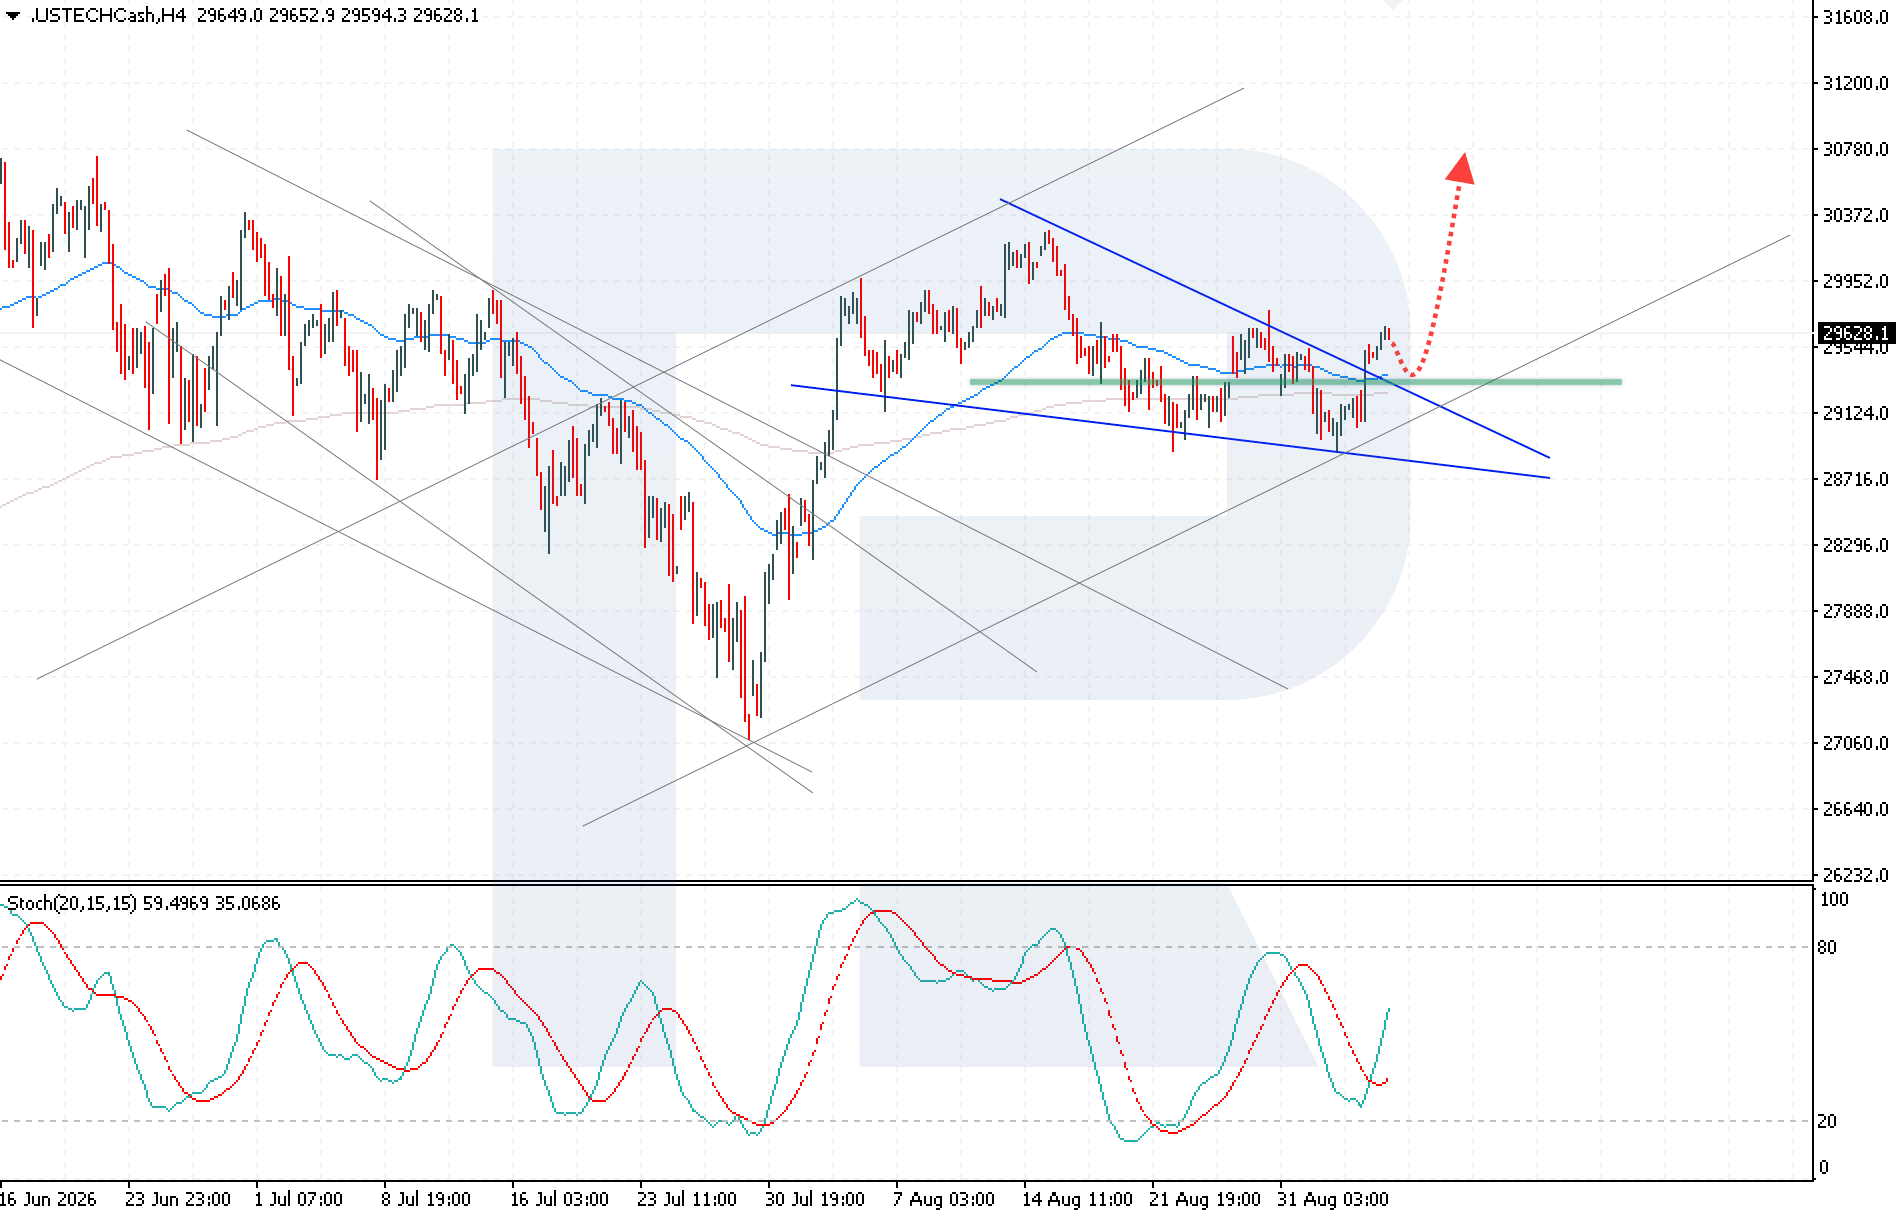
The US Tech is rising for the third consecutive trading session and testing a key resistance level, with the price currently at 29,628.1.
US Tech forecast: key takeaways
- Selling pressure has intensified near the current local highs
- The short-term risk of profit-taking in the US Tech is increasing significantly after three consecutive days of a bullish rally
US Tech fundamental analysis
The US Tech has risen for the third consecutive trading session, reaching the 29,675 resistance level, near which selling pressure intensified.
Today, investors are focused on the US labour market report for August. The published data could determine the next move in the technology index and adjust expectations regarding the Federal Reserve’s decision. Traders expect employment growth to recover after an unexpected decline in jobs in July. A weaker report could boost expectations of monetary easing and further support technology stocks, while strong data could revive concerns that the Federal Reserve will maintain a restrictive stance.
In the short term, the technical picture for the US Tech remains moderately bullish, although the risk of profit-taking is increasing after three sessions of gains. Volatility may rise significantly following the release of labour market data. High oil prices amid tensions surrounding Iran and the Strait of Hormuz remain an additional risk factor. A further rise in energy prices could fuel inflation expectations and limit the Federal Reserve’s scope to ease monetary policy.
US Tech technical analysis
The US Tech has consolidated above the upper boundary of the Wedge reversal pattern, indicating a high probability of bullish momentum. The US Tech forecast for today suggests renewed growth after a rebound from the pattern’s upper boundary, with a potential target at 31,695 USD.
The technical picture remains favourable for buyers. The Stochastic Oscillator has formed a bullish crossover, increasing the likelihood of continued upward movement in the near term. A strong breakout above the resistance level and price consolidation above 29,675 would be an additional signal of further growth. This would confirm the strength of the current momentum, which could accelerate the bullish scenario.
At the same time, the risk of an alternative scenario remains if the price breaks below the lower boundary of the bullish channel and consolidates below 29,105. In this case, the likelihood of a deeper correction would increase significantly.
Main scenario (Buy Stop)
A breakout above the local 29,675.0 resistance level would indicate continued development of the Wedge reversal pattern, with a target at 31,695.0.
- Current price: 29,628.1
- Entry price: 29,675.0
- Stop loss: 29,365.0
- Take profit: 31,695.0
- Risk-to-reward ratio: more than 1:6
Alternative scenario (Sell Stop)
A breakout below the lower boundary of the bullish channel, followed by consolidation below 29,105.0, would signal renewed bearish pressure and open the way for a further decline in the US Tech.
- Entry level: 29,105.0
- Stop loss: 29,465.0
- Take profit: 28,205.0
- Risk-to-reward ratio: more than 1:2
The trade idea is valid until 8:00 AM (server time, UTC+3) on 8 September 2026.
Summary
The US Tech index’s consolidation above the reversal pattern and bullish signals from the Stochastic Oscillator indicate further upside potential. However, today’s Nonfarm Payrolls release and inflationary pressure from the oil market could trigger profit-taking.
Editors’ picks

EURUSD forecast 2026–2027: technical analysis, price levels & predictions
EURUSD has recovered from the July lows and is trading near 1.1545 — back in bullish territory. The pair has reclaimed EMA65 on the daily, formed a bullish EMA crossover on H4, and the US-eurozone GDP gap has narrowed sharply (US 1.5% vs eurozone 1.0%). Goldman Sachs and Deutsche Bank both now target 1.2500 by year-end. A confirmed close above 1.1700 opens the path to 1.1805. We break down the key levels, three trading scenarios, and what the unprecedented 9-3 FOMC dissent vote means for EURUSD.

Gold (XAUUSD) forecast 2026: technical analysis, price levels & predictions
Gold has reversed its downtrend and is trading near 4,360 USD, back above both EMA65 and EMA200. ETF flows turned positive in July with 3 billion USD of net inflows, and central banks bought 288.9 tonnes in Q2 — up 62% year-on-year. A breakout above 4,500 USD opens the path to 4,855 USD and the 5,597 USD all-time high. We break down the key levels, three trading scenarios with entry triggers, and what J.P. Morgan, Deutsche Bank and Goldman Sachs are forecasting for gold in 2026.
Ang mga pagtataya na ipinakita sa seksyong ito ay nagpapakita lamang ng pribadong opinyon ng may-akda at hindi dapat ituring bilang gabay para sa pagtetrade. Walang pananagutan ang RoboForex para sa mga resulta ng pagtetrade batay sa mga rekomendasyon sa pagtetrade na inilarawan sa mga analytical review na ito.