
US Tech rises on optimism in the AI sector
US Tech has reached a new all-time high and is now correcting. The current price is 30,682.
US Tech forecast: key takeaways
- The US Services Purchasing Managers Index rose to 58.7
- The yield on 30-year US Treasuries rose to 5.44%, the highest level since 2004
US Tech fundamental analysis
The combination of two factors — a sharp rise in long-term US Treasury yields and a much stronger-than-expected services business activity index — is creating a primarily negative backdrop for US Tech. This does not point to a deterioration in the US economy. On the contrary, economic activity remains too strong for inflationary pressure to fall quickly and for monetary policy to be eased. The rise in long-term yields reflects not only expectations for Federal Reserve policy, but also resilient economic growth, inflation risks, high energy prices, and the need to finance a substantial amount of government debt.
This is particularly important for US Tech. Technology companies are valued to a large extent on the basis of expected cash flows and profits to be generated many years into the future. The higher the risk-free return on government bonds, the higher the discount rate applied to those future earnings. As a result, all else being equal, the acceptable valuation of a technology company becomes lower.
US Tech technical analysis
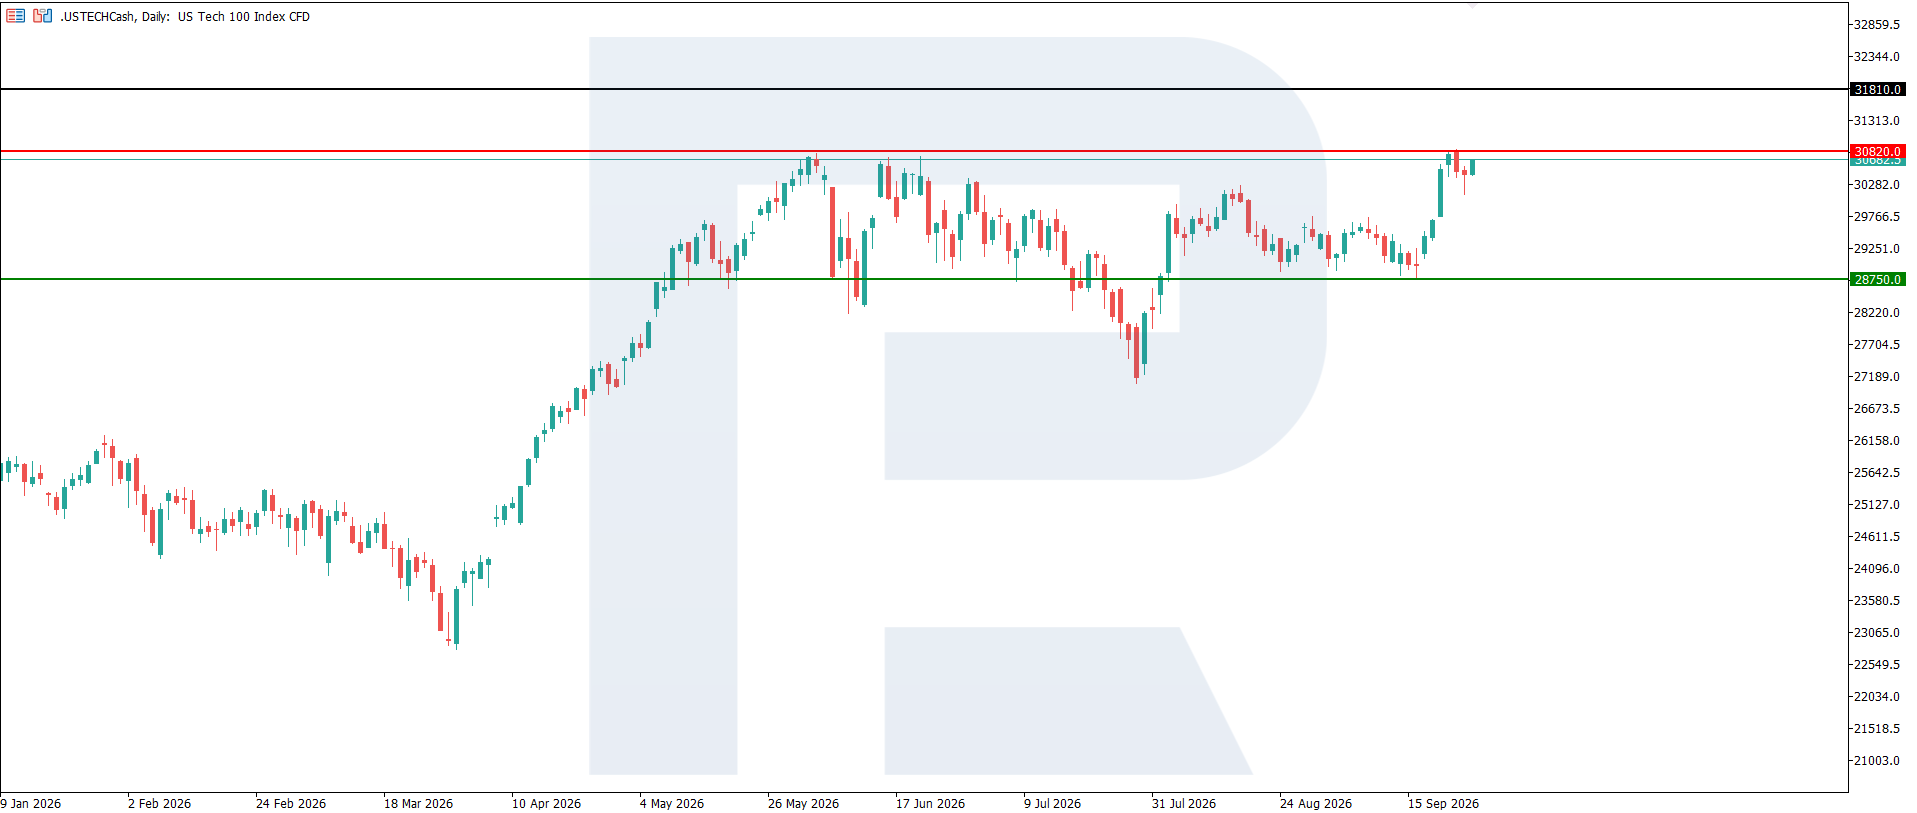
On the D1 timeframe, US Tech formed support at 28,750, while resistance developed at 30,820. The broader trend remains bullish. Following a new all-time high, the index is undergoing a correction. The price is highly likely to break above resistance and reach 31,810.
Otherwise, a sideways trend could form within the current support and resistance boundaries. A downtrend can only be considered if the 28,750 level is broken. The first downside target could be 28,230.
US Tech trading scenario for today
Trading scenario (Buy Stop)
Consolidation of the index above the 30,820 resistance level would confirm the bullish US Tech scenario and indicate a rise towards the 31,810 target.
- Current price: 30,682
- Entry level: 30,850
- Stop Loss: 30,600
- Take Profit: 31,810
- Risk-to-reward ratio: above 1:3.8
The trade idea is valid until 08:00 AM on 1 October 2026 (server time, UTC+3).
Risk factors
The main risks for US Tech and the US equity market are linked to a further rise in Treasury yields and the Federal Reserve maintaining a restrictive policy stance. Strong economic activity and persistent inflationary pressure could force the regulator to keep interest rates high for longer, increasing the cost of capital and putting additional pressure on technology-company valuations.
Summary
A strong economy supports corporate earnings and reduces the likelihood of a sharp deterioration in companies' financial results. The main risk now is that earnings growth may not be fast enough to offset the increase in returns required by investors. A breakout and consolidation above 30,820 would confirm the bullish scenario and open the way towards the 31,810 USD target.
Editors’ picks

EURUSD forecast 2026–2027: technical analysis, price levels & predictions
The EURUSD outlook for 2026 and 2027: key levels on the daily chart, three trading scenarios and the policy gap between the Fed and the ECB that drives the pair.

Gold (XAUUSD) forecast 2026: technical analysis, price levels & predictions
Where gold could trade in 2026: key levels, three trading scenarios with entry triggers and the forecasts from J.P. Morgan, Deutsche Bank and Goldman Sachs.
Ang mga pagtataya na ipinakita sa seksyong ito ay nagpapakita lamang ng pribadong opinyon ng may-akda at hindi dapat ituring bilang gabay para sa pagtetrade. Walang pananagutan ang RoboForex para sa mga resulta ng pagtetrade batay sa mga rekomendasyon sa pagtetrade na inilarawan sa mga analytical review na ito.