
US Tech enters a downtrend
The US Tech has shifted into a downtrend following the release of US inflation data and concerns about revenue growth in the AI sector. The price currently stands at 29,920.
US Tech forecast: key takeaways
- Yields on 30-year US Treasury bonds have begun to decline thanks to demand from the US Treasury
- The US Consumer Price Index rose by 3.7% year-on-year
- US Tech forecast for 16 October 2026: 28,175
US Tech fundamental analysis
US consumer inflation data for September 2026, released on 14 October, creates a largely negative outlook for the US stock market, particularly the technology sector and the US Tech index. Annual CPI accelerated from 3.4% to 3.7%, exceeding analysts' forecast of 3.6%. Month-on-month inflation came in at 0.6%, in line with expectations but significantly higher than August's 0.4% reading. Additional concerns stem from the acceleration in annual core inflation from 2.4% to 2.6%, against a forecast of 2.5%. Meanwhile, the monthly core CPI rose by 0.3%, compared to an expected 0.2%. These developments indicate persistent inflationary pressures in the US economy and increase the likelihood of the Federal Reserve maintaining relatively tight monetary policy for an extended period.
The published figures could have the greatest impact on the US Tech index, as technology companies are particularly sensitive to changes in interest rates and US Treasury yields. A substantial part of these companies' valuations is based on expectations of earnings growth in the years ahead. When interest rates rise, investors discount future cash flows at a higher rate, reducing the estimated value of shares even if revenue continues to grow.
An alternative scenario suggests a gradual easing of inflationary pressures in the coming months, particularly as energy prices stabilise. In this case, the likelihood of further interest rate hikes could diminish, creating conditions for a recovery in demand for technology stocks. If corporate earnings also continue to grow steadily, the US Tech index could resume its upward movement.
US Tech technical analysis
The US Tech index is undergoing a correction following a sharp downward move. The uptrend has been broken. The resistance level has formed at 31,050, while the 30,100 support level has been breached. If the price consolidates below this mark, a sustained downtrend could develop. The downside target is 28,175.
An alternative scenario remains possible. A breakout above the 31,050 resistance level would signal a trend reversal. In this case, the price could rise to 31,800.
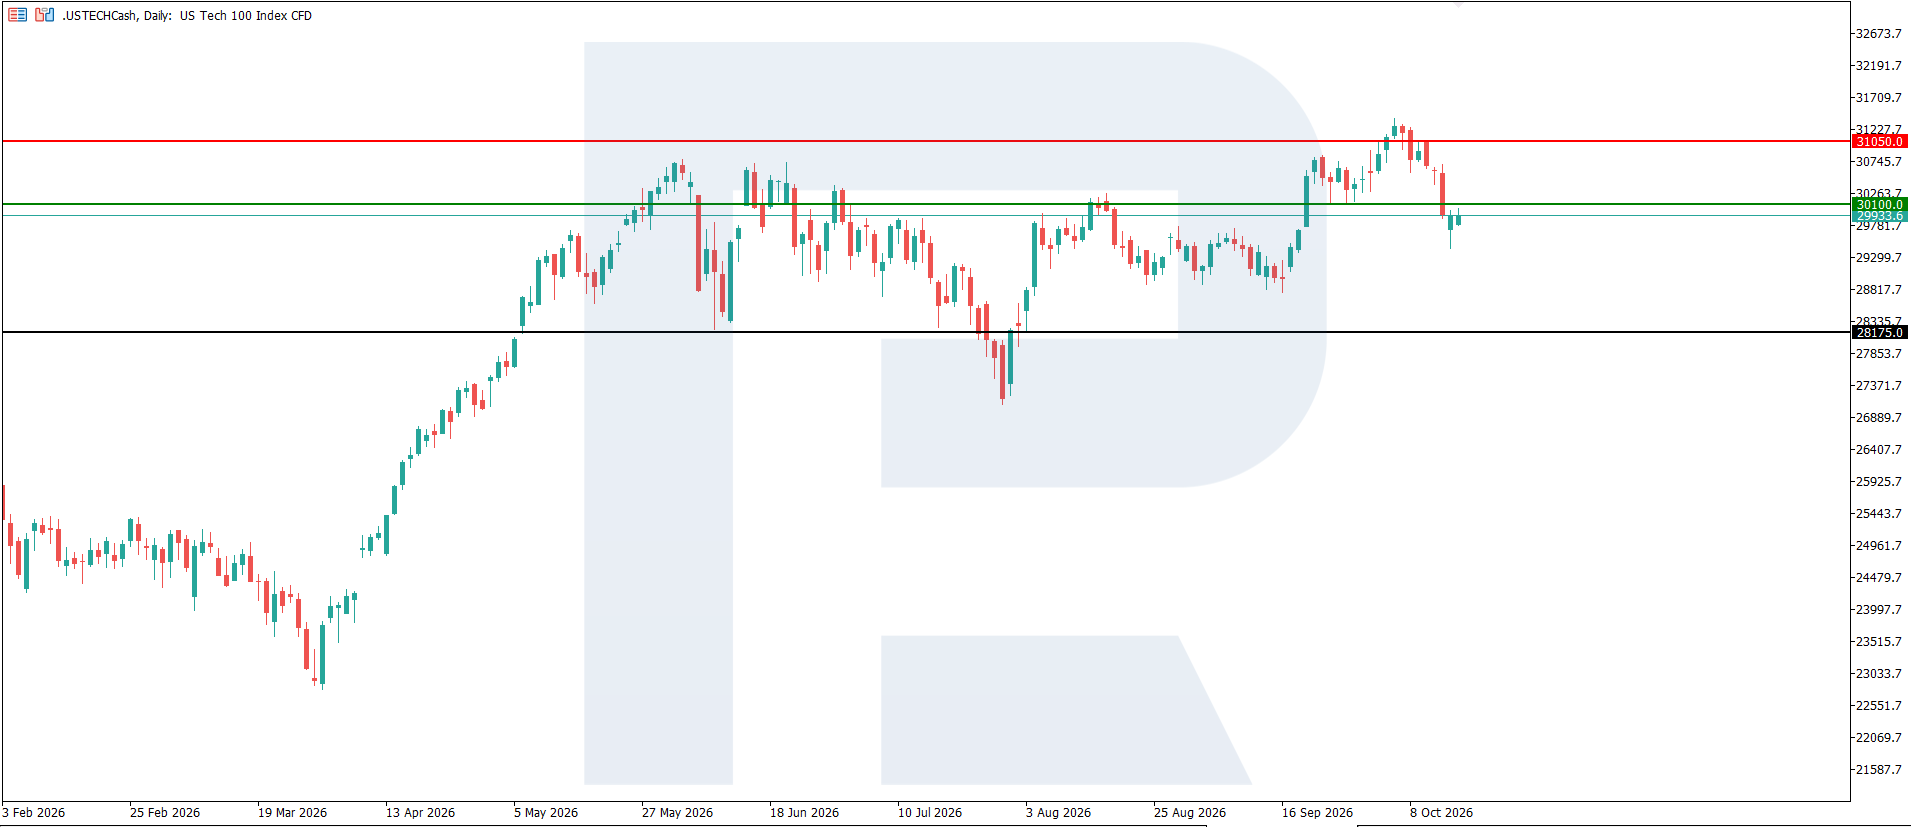
US Tech trading scenario for today
Trading scenario (Sell Limit)
A consolidation below the 30,100 support level would confirm the bearish scenario for the US Tech and indicate bearish momentum towards the 28,175 target.
- Current quote: 29,920
- Entry level: 31,100
- Stop loss: 31,300
- Take profit: 28,175
- Risk-to-reward ratio: more than 1:4.5
The trade idea is valid until 8:00 AM on 23 October 2026 (server time, UTC+3).
Risk factors
The main risk factors for the US Tech index remain accelerating US inflation, persistently high Federal Reserve interest rates, and a potential rise in government bond yields. Higher borrowing costs, slowing consumer demand, and deteriorating corporate financial results could put additional pressure on the technology sector. Inflationary pressures remaining above market expectations increase the likelihood that investors will reassess technology company valuations and that the US Tech index will undergo a downward correction.
Summary
Accelerating consumer inflation in the US and actual CPI readings exceeding market forecasts create a negative backdrop for the US Tech index. In the short term, a downward correction in the US Tech is becoming more likely, while its future performance will depend on subsequent inflation data, Federal Reserve decisions, and corporate earnings reports.
Editors’ picks

EURUSD forecast 2026–2027: technical analysis, price levels & predictions
The EURUSD outlook for 2026 and 2027: key levels on the daily chart, three trading scenarios and the policy gap between the Fed and the ECB that drives the pair.

Gold (XAUUSD) forecast 2026: technical analysis, price levels & predictions
Where gold could trade in 2026: key levels, three trading scenarios with entry triggers and the forecasts from J.P. Morgan, Deutsche Bank and Goldman Sachs.
Ang mga pagtataya na ipinakita sa seksyong ito ay nagpapakita lamang ng pribadong opinyon ng may-akda at hindi dapat ituring bilang gabay para sa pagtetrade. Walang pananagutan ang RoboForex para sa mga resulta ng pagtetrade batay sa mga rekomendasyon sa pagtetrade na inilarawan sa mga analytical review na ito.