
Psychologists recommend formulating your goals as precisely and carefully as possible, projecting them on your subconscious and controlling your progress towards them. Systematic investors and traders have managed to secure themselves at the top of the market not just because they own some super system or insider information; the reason is, their goals are based on their long-time experience, their knowledge, technology, psychological stability and skillfull risk and money management. Trading without a clear idea of what, when and how we are planning to reach washes the main part of "plankton" off the market very quickly. The more detailed and realistic your goals are, the lower the risk of losing your deposit.
All posts

5 min
Trading against the main trend entails lots of difficulties and additional risks. As a rule, the trader in such a situation tries to catch a correction; however, it would be more efficient to wait for the completion of the current trend and enter a trade in the new trend. Even the most high-quality signal or pattern always realizes if it goes against the main trend. The trader has to be as attentive as possible and control risks if they try to enter trades against the main movement or catch the completion of the latter.

4 min
The Flag and Pennant patterns appear rather frequently on price charts. They are trend continuation patterns, working in the presence of a strong trend, same as trend reversal patterns. When such patterns appear, we may forecast that the trend will continue.

9 min
A Japanese candlestick chart looks like a rectangle with two "tails" on the top and at the bottom. Same as the bars reflects four prices...

7 min
The Gap is shown in the chart above as yellow rectangles. This is a practical gap in the flow of quotations reflecting a serious difference between the opening and closing prices in trading sessions. A quick look at the chart captures a large number of such phenomena. This means that if we classify them we may find a lot of opportunities to use them in trading. But first, let us talk about the reasons which a Gap emerges for.

5 min
The SWB Grid is an expert advisor based on the RSI, Stochastic Oscillator and Bollinger Bands indicators. One of its features is the possibility of receiving signals to open a trade from all indicators, only one indicator or a combination of those.

5 min
A trend is defined as a sequence of maximums and minimums. If we say that there is a bullish trend on the market, it means that every next maximum is higher than the previous one and every next minimum is also higher than the previous one. In this case only, we may presume that the trend is ascending and try buying.
8 min
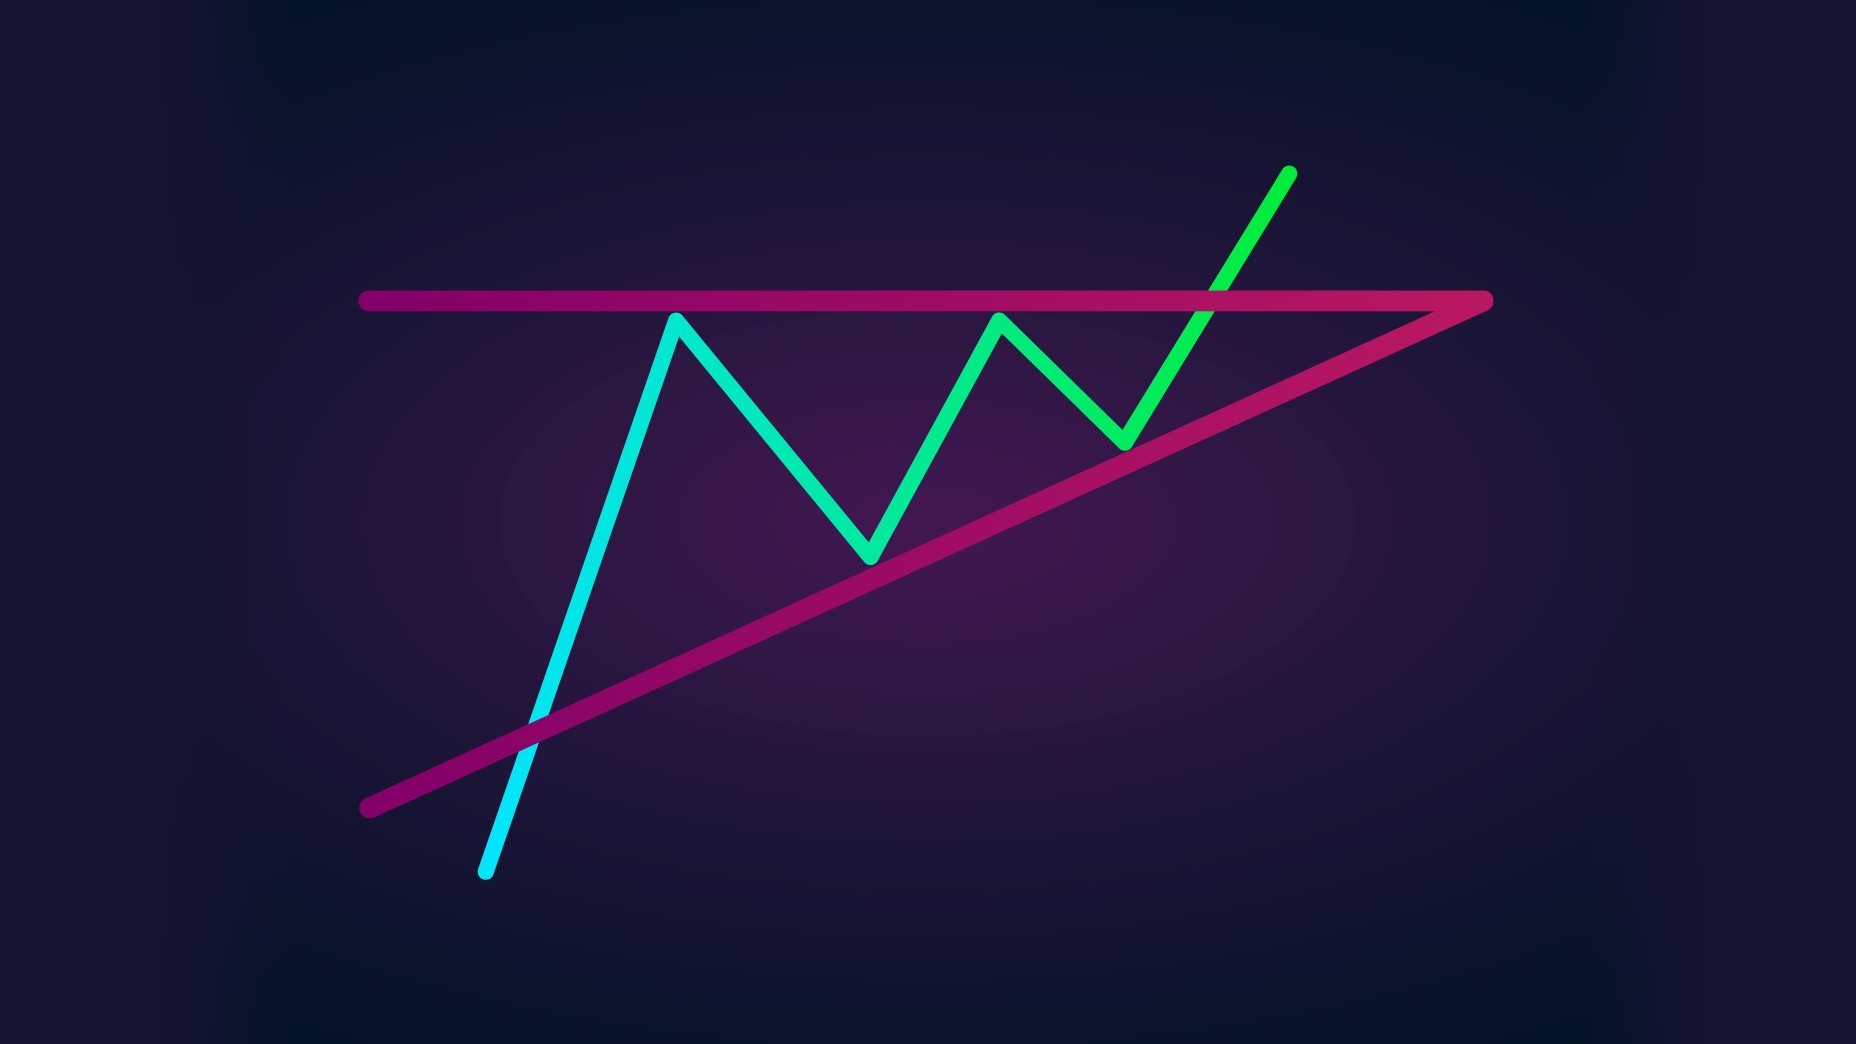
The Triangle pattern appears on different charts rather frequently. Normally, the Wedge is considered a reversal pattern, forming on maximums and minimums of a price chart in an up- or downtrend. A Wedge is quite similar to a Triangle, forming between the two converging support and resistance lines.

8 min
One of the most popular indicators (and, perhaps, the one that a trader first comes across starting their way on Forex) is the Moving Average (MA). The Moving Average belongs to the group of trend indicators and shows the average price of the chosen currency during a certain period of time.

8 min
The history of the Pivot Points indicator began in the early 30s of the twentieth century when a mathematician and a that-time famous trader Henry Chase decided to create an indicator meant for the security market. The synonym for a pivot would be a reversal, so a pivot point is a level on which the price reverses. So, the basis of the Pivot Point indicator is the idea that the market takes everything into account and repeats itself with time. The indicator was created in such a way that the opening and closing prices may serve as the support and resistance levels in the future.

4 min
The author of the Parabolic Sar is J. Welles Wilder. He first used it in 1976. In his book "New Concepts In Technical Trading Systems" Wilder presented several indicators: the Parabolic Sar, RSI, ADX.

8 min
This structure of price movement is, in fact, a Wedge pattern. According to the author of the method, a trader should have their unique features and use rare trading instruments in order to be different from the rest of the market players. The Wolfe Waves pattern is able to provide a beginner trader with the keys to a new understanding of market behavior. However, as with any other trading strategy or technical instrument, no matter how successful its trading history may be, much depends on the hands the instrument gets in.

6 min
Stochastic Oscillator chart is drawn in a separate window under the price chart and consists of two lines: %K, quick one, and %D, slow one. Its values vary from 0% to 100%; at the levels of 20% and 80% signal lines, defining the oversold (0-20%) and overbought (80-100%) areas, are drawn.

9 min
System CCI expert advisor works on the basis of well-known indicator Commodity Channel Index (CCI hereafter), included in a standard list of indicators of the MetaTrader 4 terminal. For opening a position, a signal line of the CCI and default levels of the EA are used. The levels are customizable for a more precise opening of positions.

6 min
EXTRA strategy, like any other, has long-term, mid-term and short-term goals. At the basis of this strategy lies a MATRIX. A matrix is practically the basic structure of the Elliott waves.