EURUSD, USDJPY, GBPUSD, AUDUSD, USDCAD, XAUUSD, and Brent technical analysis and forecast for 13 January 2025
Here is a detailed daily technical analysis and forecast for EURUSD, USDJPY, GBPUSD, AUDUSD, USDCAD, XAUUSD, and Brent for 13 January 2025.
EURUSD forecast
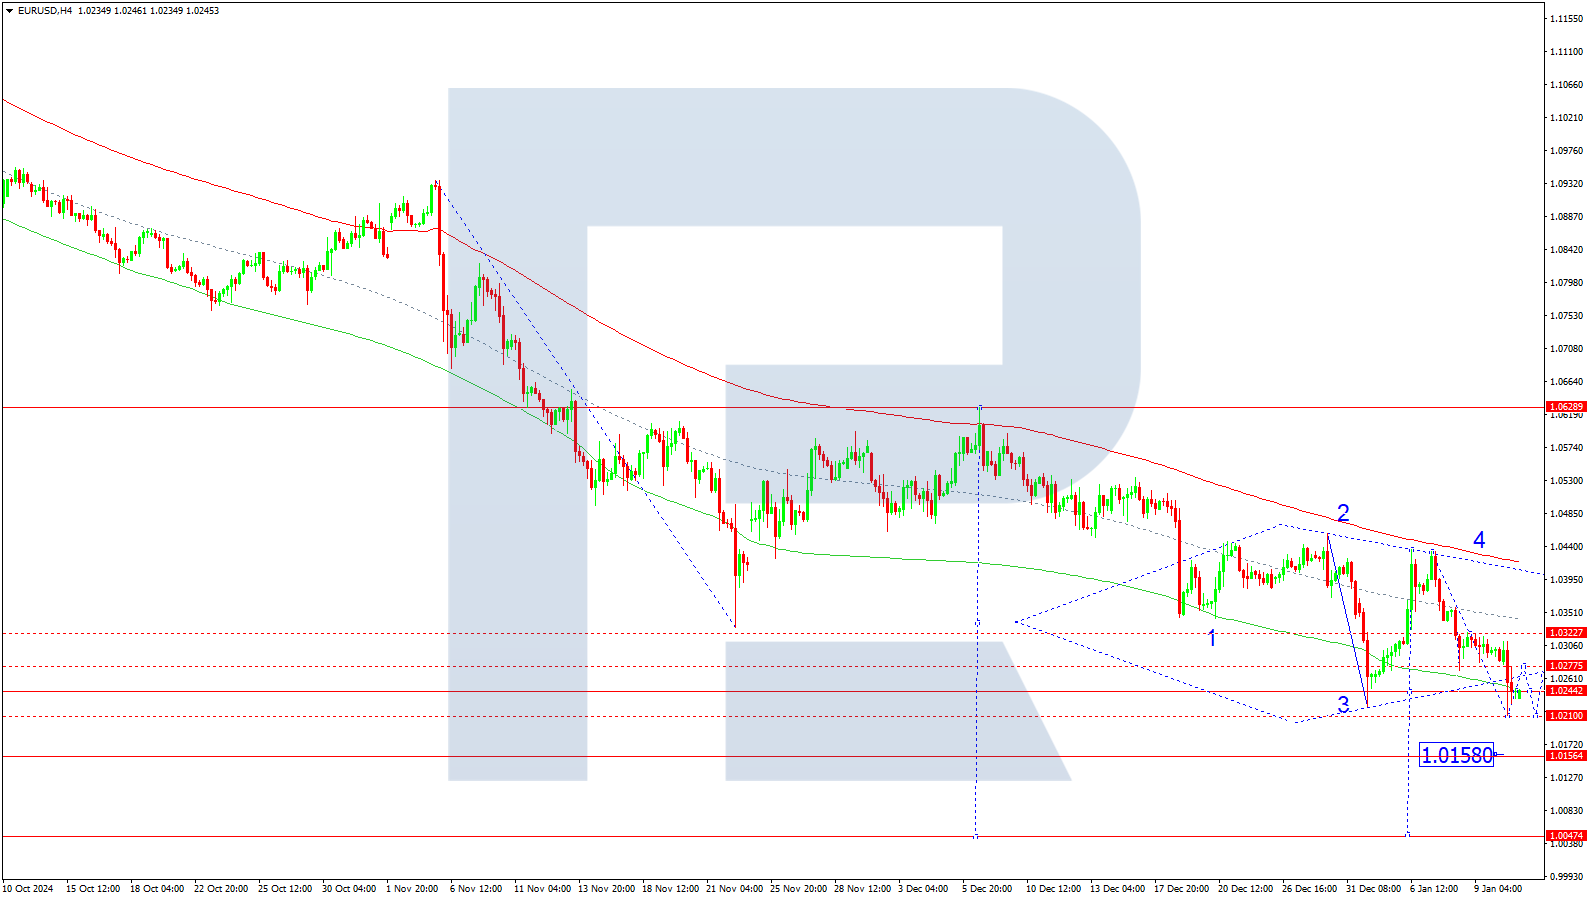
On the EURUSD H4 chart, the market has formed a downward wave structure towards the 1.0211 level and a correction towards 1.0277. Another downward wave is expected today, 13 January 2025, aiming for 1.0210. Subsequently, the price could rise towards 1.0277, and if it breaks above this level, the correction may extend towards 1.0322, followed by a breakout below this range. A downward wave towards the local target of 1.0158 is anticipated. After reaching this level, the price could correct upwards towards 1.0244 (testing from below). The consolidation structure around the 1.0244 level is viewed as a continuation pattern within the ongoing downward trend towards 1.0050, the first target.
The Elliott Wave structure and matrix for the fifth downward wave, with a pivot point at 1.0244, technically validate this scenario. The level is considered crucial for this wave in the EURUSD rate. The market has rebounded downwards from the central line of the price Envelope at 1.0322 and continues its descent towards the Envelope’s lower boundary at 1.0158.
Technical indicators for today’s EURUSD forecast suggest a potential decline towards the 1.0158 and 1.0050 levels.
USDJPY forecast
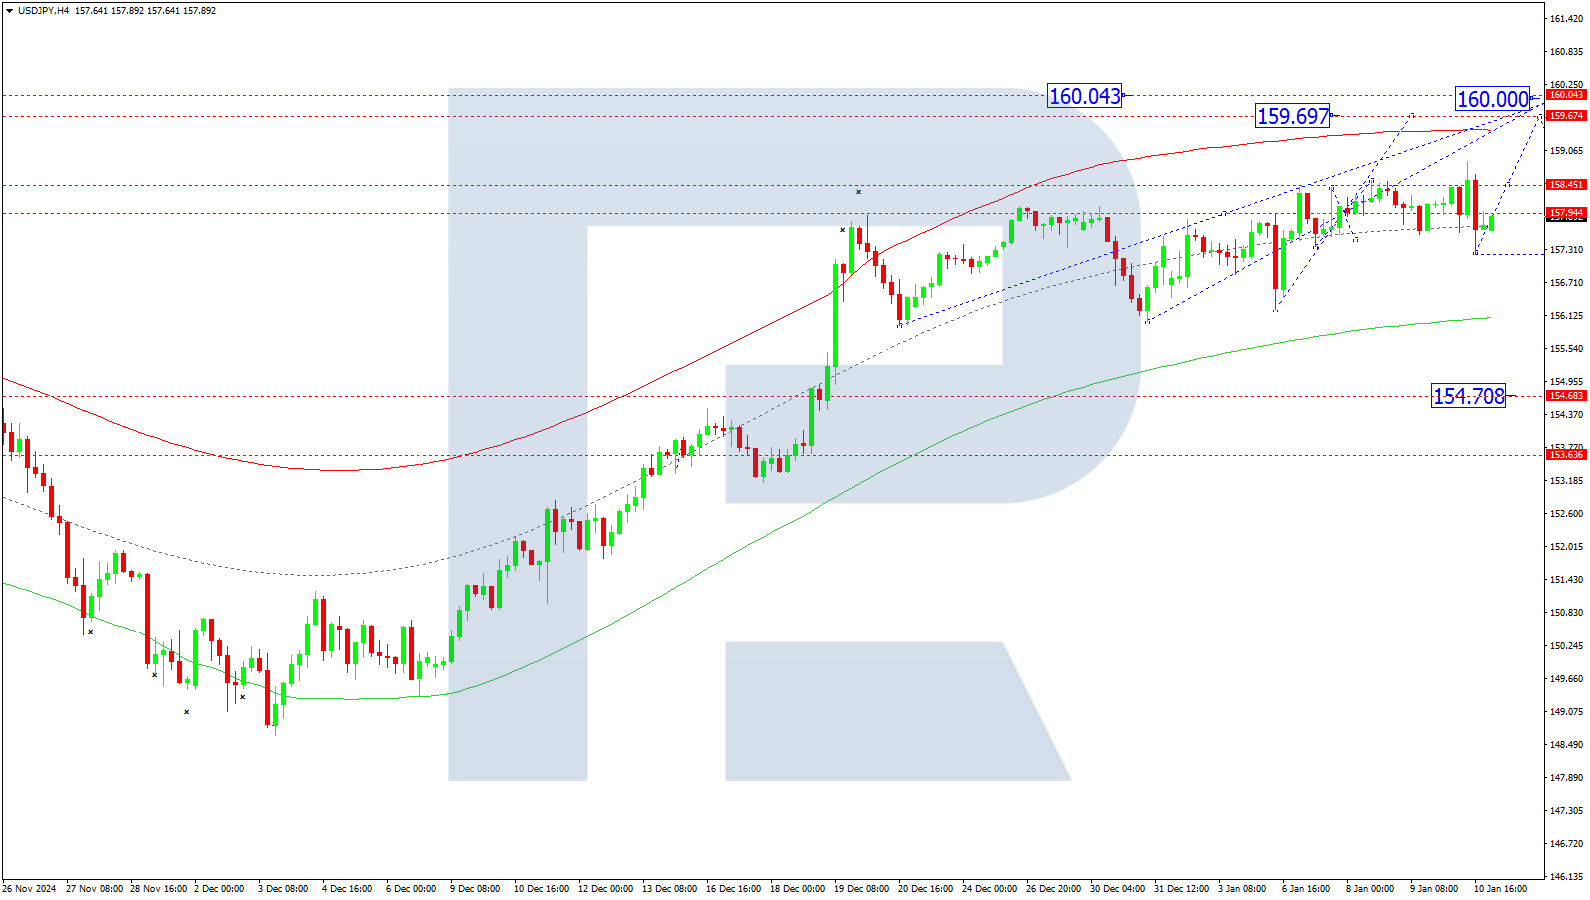
On the USDJPY H4 chart, the market has completed a growth wave towards the 158.87 level. Today, 13 January 2025, a downward impulse has formed, aiming for 157.22. Subsequently, a consolidation range may develop above this level. A breakout above the range might lead to a growth wave towards 159.69. Conversely, a breakout below the range would signal the potential for a correction towards 156.00, possibly extending the wave towards 154.70. Once the correction concludes, a new growth wave is expected, targeting 159.69.
The Elliott Wave structure and growth wave matrix, with a pivot point at 157.94, technically confirm this scenario for the USDJPY rate. The market is currently near the central line of the price Envelope. A downward wave could develop towards its lower boundary at 156.00. Subsequently, a growth wave towards the Envelope’s upper boundary at 159.69 is possible.
Technical indicators for today’s USDJPY forecast suggest a potential correction towards the 156.00 level.
GBPUSD forecast
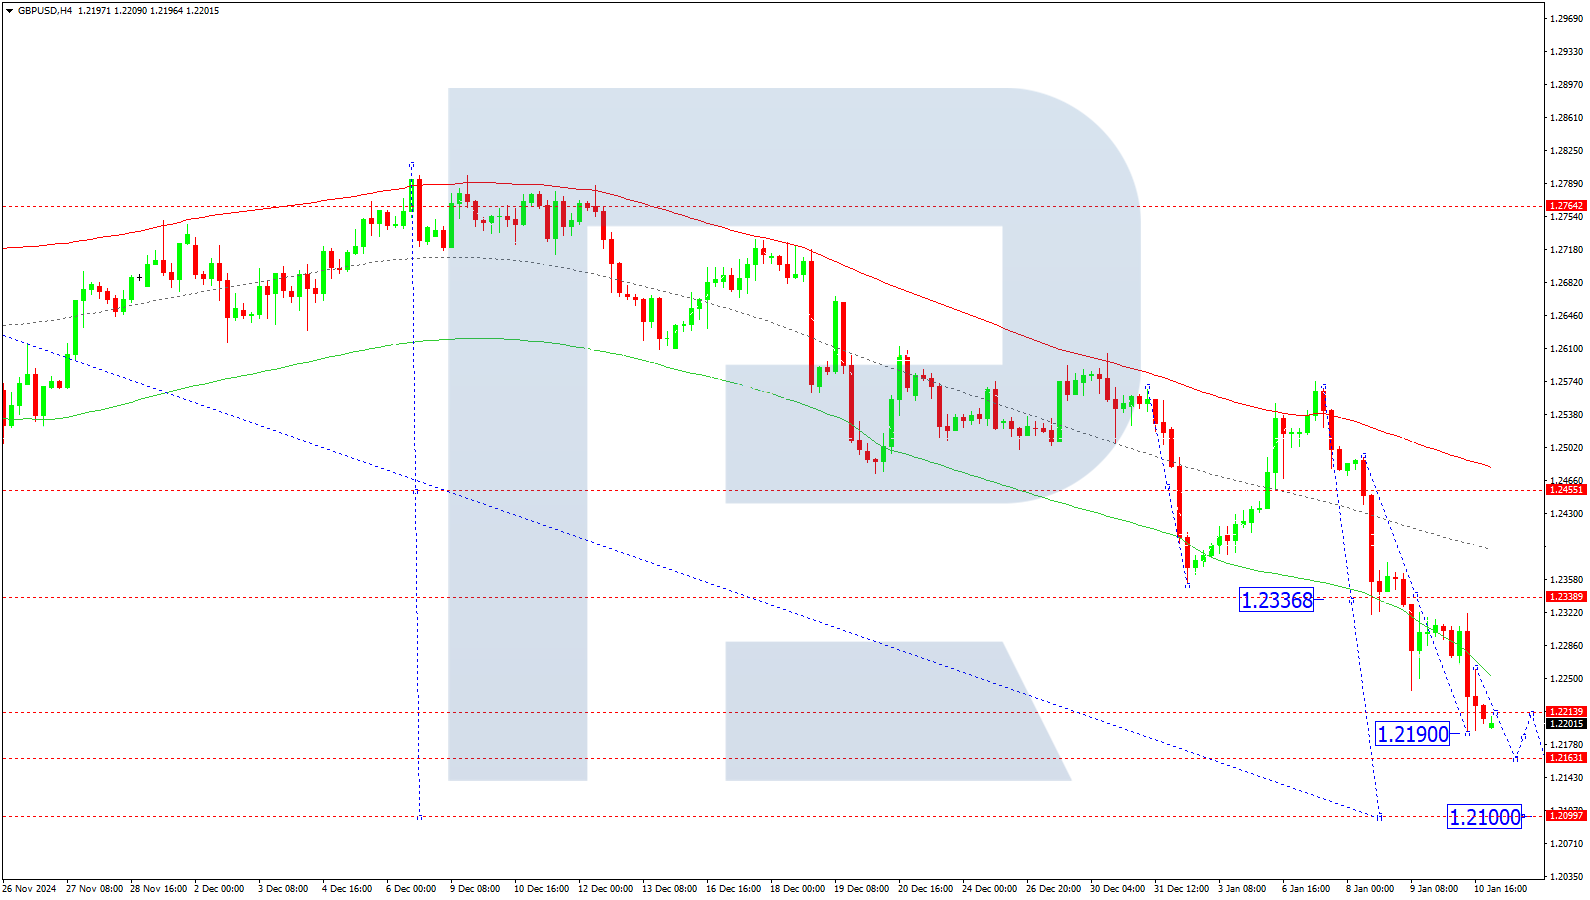
On the GBPUSD H4 chart, the market has breached the 1.2266 level and completed a downward wave towards the 1.2190 level. A correction has formed towards 1.2260. Today, 13 January 2025, a downward wave is anticipated to target 1.2100. After the price reaches this level, a correction towards 1.2215 will likely follow. If this level is breached, the upward structure could continue towards 1.2333.
The Elliott Wave structure and wave matrix, with a pivot point at 1.2333, technically validate this scenario for the GBPUSD rate. The market has rebounded from the upper boundary of the price Envelope at 1.2568 and is maintaining its downward momentum towards its lower boundary at 1.2100, the primary estimated target.
Technical indicators for today’s GBPUSD forecast suggest that the downward wave could continue towards the 1.2100 level.
AUDUSD forecast
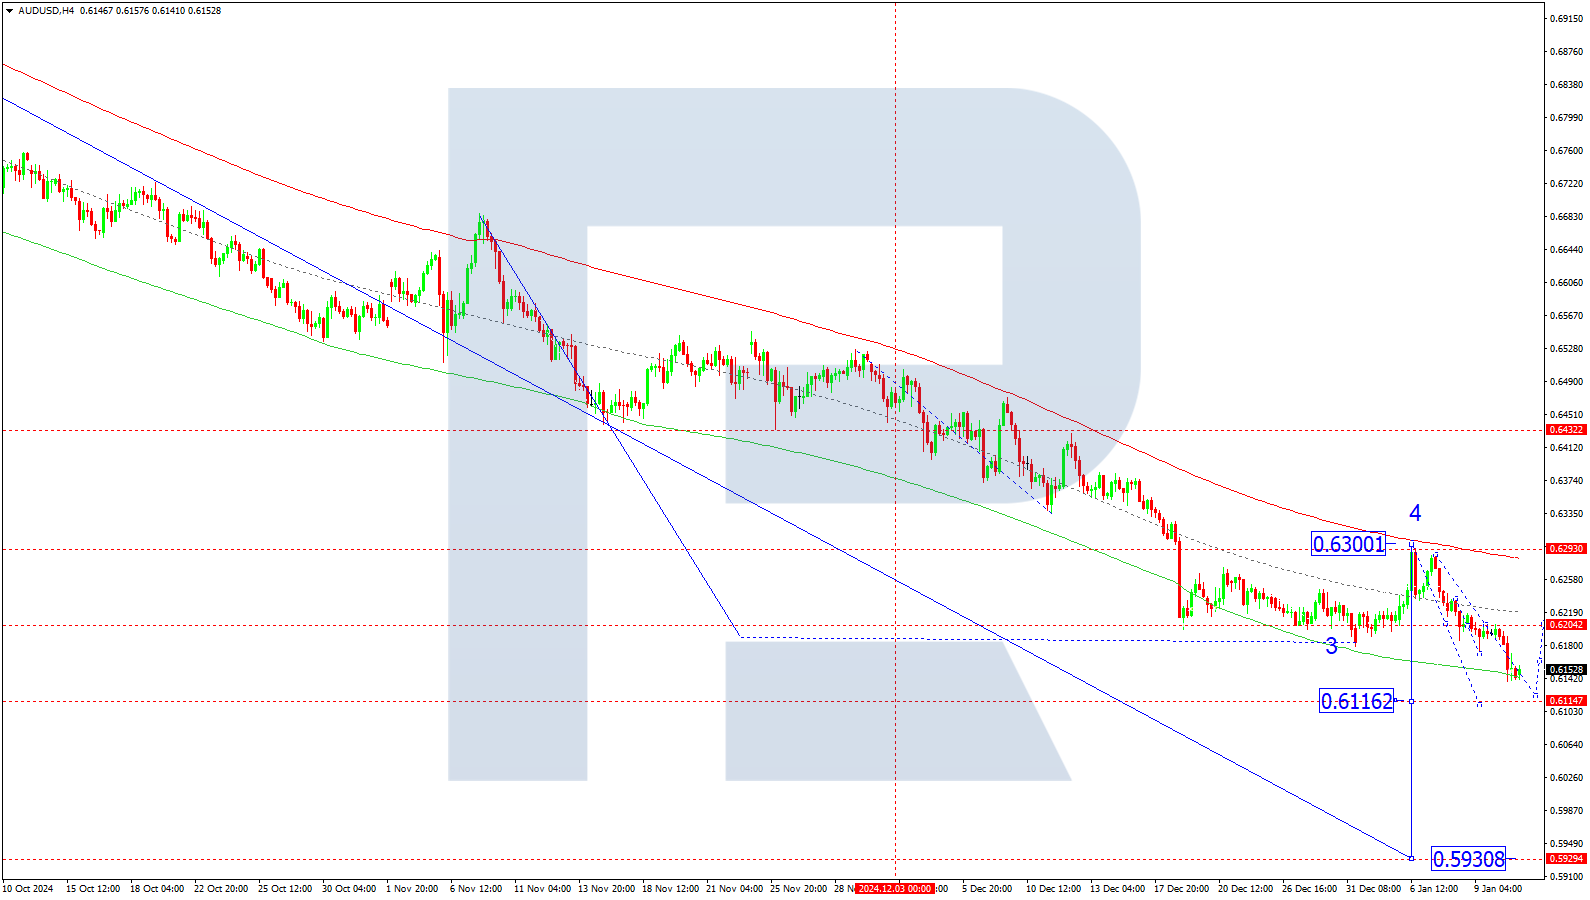
On the H4 chart, AUDUSD has breached the 0.6185 level and continues to decline towards 0.6116. Today, 13 January 2025, reaching this target is anticipated. A correction to the 0.6200 level may follow, with a subsequent new downward wave expected to reach 0.6000, continuing the trend towards 0.5930.
Technically, this scenario is supported by the Elliott wave structure and the downward wave matrix for the AUDUSD rate, pivoted at 0.6200. The market is currently developing a wave targeting the lower boundary of the price Envelope at 0.6116. After reaching this target, a rise to the central line at 0.6200 is likely, with a further decline to the lower boundary at 0.6022 projected.
Technical indicators for today’s AUDUSD forecast suggest potential declines to 0.6116 and 0.6022.
USDCAD forecast
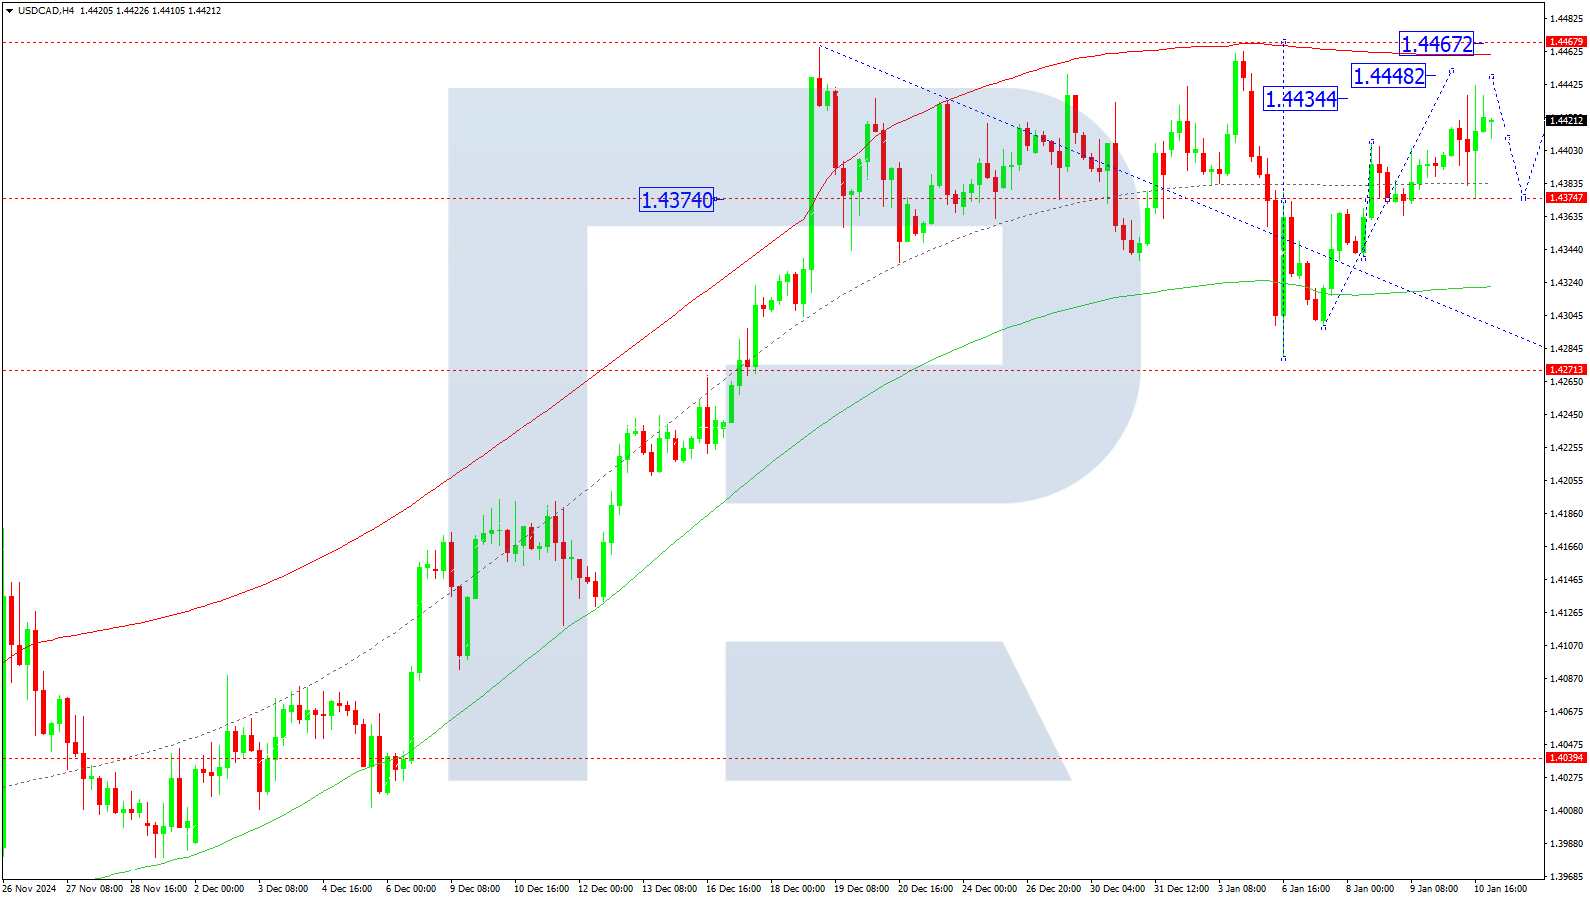
On the H4 chart, USDCAD has completed a growth wave towards 1.4440, followed by a correction to 1.4375. Today, 13 January 2025, a further upward wave towards 1.4448 is expected. Subsequently, consolidation may develop, with a potential breakout upwards, extending the wave to 1.4466 and 1.4488. A downward breakout could lead to a correction to 1.4375, followed by further growth towards 1.4466.
Technically, the Elliott wave structure and the wave matrix, pivoted at 1.4375, support this scenario. This level is considered crucial for this wave in the USDCAD rate. The market is advancing towards the upper boundary of the price Envelope at 1.4466. After reaching this level, a decline to the lower boundary at 1.4270 is anticipated. A breakout below this level will open the potential for a decline to 1.4040.
Technical indicators for today’s USDCAD forecast suggest the likelihood of further growth towards 1.4466 and 1.4488.
XAUUSD forecast
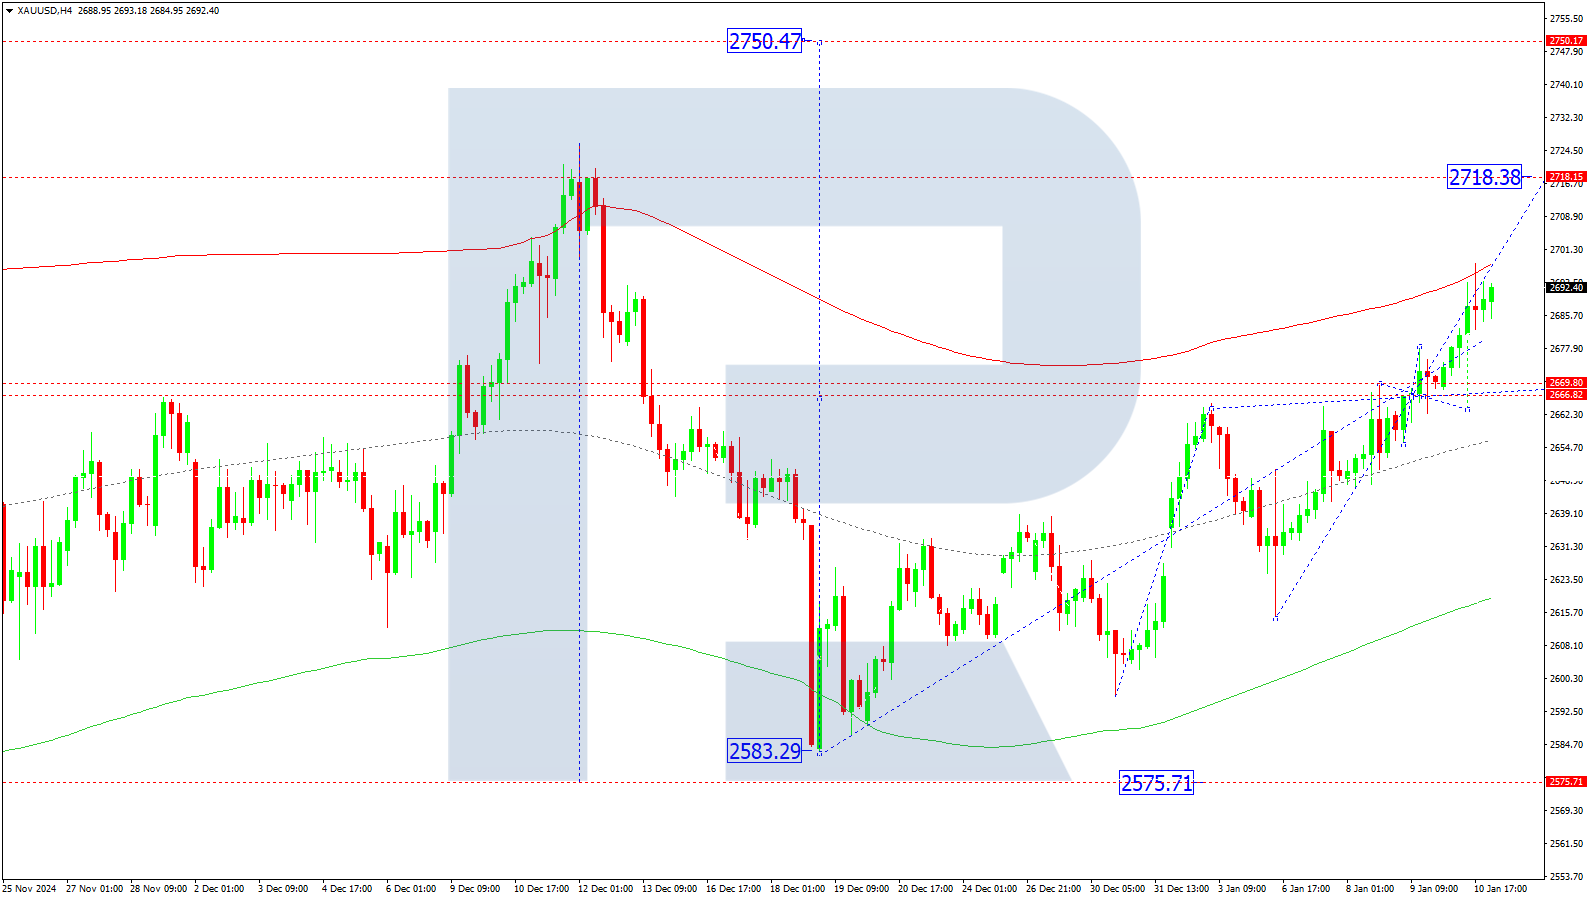
On the H4 chart, XAUUSD has broken above 2,666 and completed a growth wave to 2,697. Today, 13 January 2025, consolidation below this level is anticipated. A downward breakout could lead to a correction to 2,666, followed by potential growth to 2,718 as the local target. After reaching this level, a correction to 2,690 may follow, with further growth towards 2,750 expected.
Technically, the Elliott wave structure and the wave matrix, pivoted at 2,666, support this scenario. This level is considered crucial for this growth wave in the XAUUSD rate. Further growth towards the upper boundary of the price Envelope at 2,718 is likely, with a subsequent potential decline to the lower boundary at 2,666.
Technical indicators for today’s XAUUSD forecast suggest the likelihood of growth to 2,718.
Brent forecast
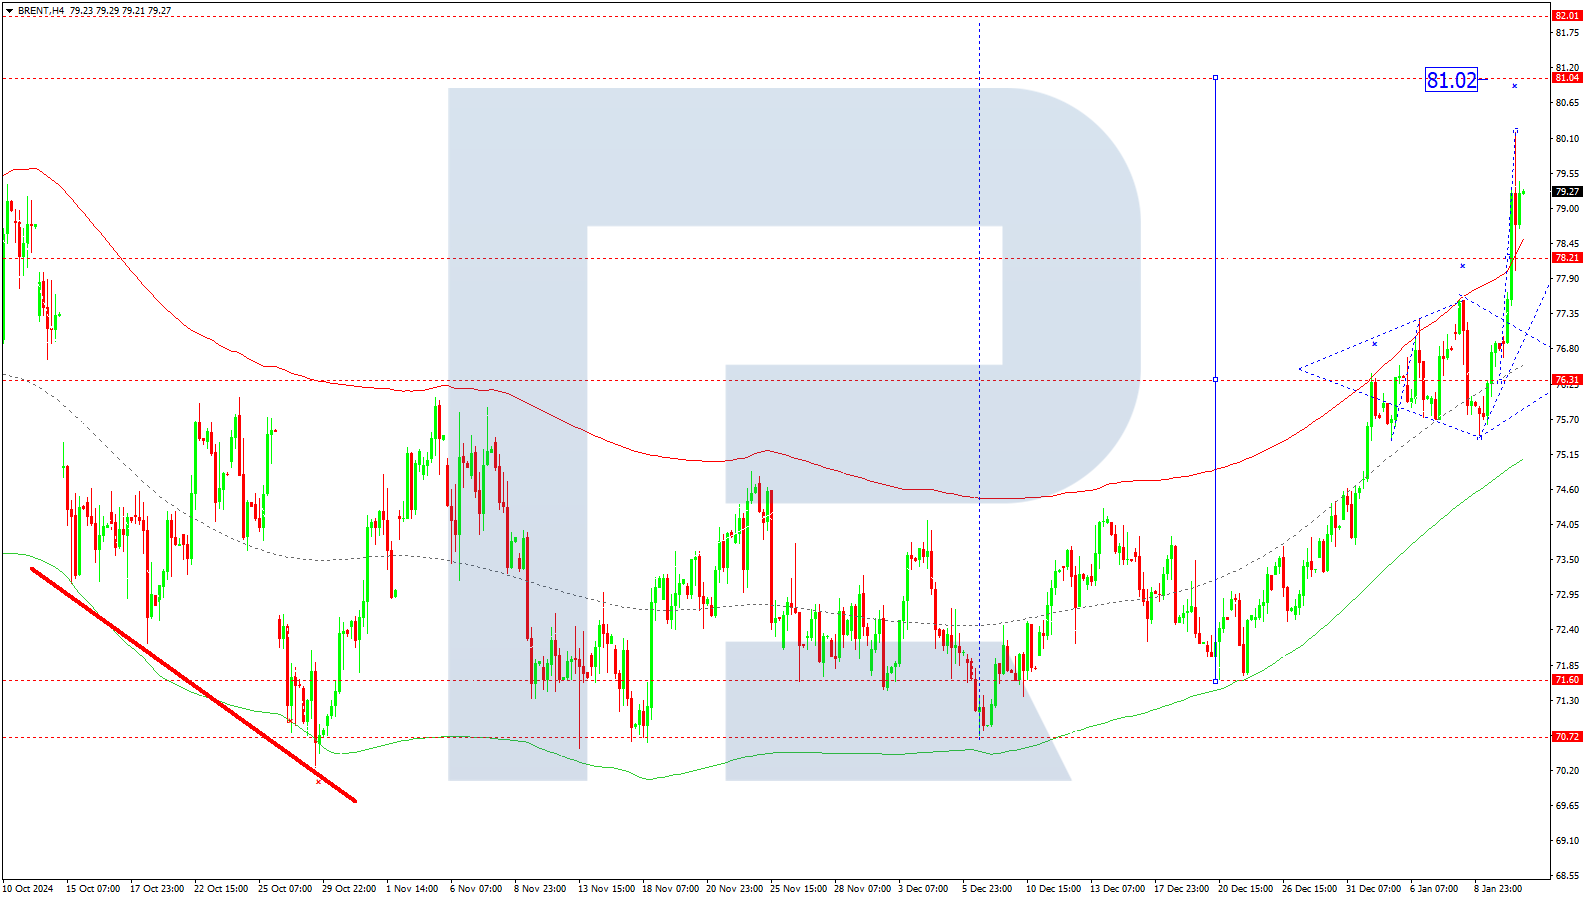
On the H4 chart, Brent crude oil has completed a growth wave towards 80.22, followed by a correction to 78.22. Today, 13 January 2025, a rise to 81.00 is expected as the local target. A correction to 78.22 may follow, after which a new wave of growth towards 82.00 is anticipated.
Technically, the Elliott wave structure and the wave matrix centred at 76.30 support this scenario. This level, around the central line of the price Envelope, is considered crucial for the Brent crude rate. Further growth towards the upper boundary of the price Envelope at 81.00 is likely today.
Technical indicators for today’s Brent crude forecast suggest potential growth to 81.00 and 82.00.
Los pronósticos de los mercados financieros son la opinión personal de sus autores. El análisis actual no es una guía de trading. RoboForex no se hace responsable de los resultados que puedan ocurrir por utilizar las recomendaciones presentadas.

