EURUSD, USDJPY, GBPUSD, AUDUSD, USDCAD, XAUUSD, and Brent technical analysis and forecast for 15 January 2025
Here is a detailed daily technical analysis and forecast for EURUSD, USDJPY, GBPUSD, AUDUSD, USDCAD, XAUUSD, and Brent for 15 January 2025.
EURUSD forecast
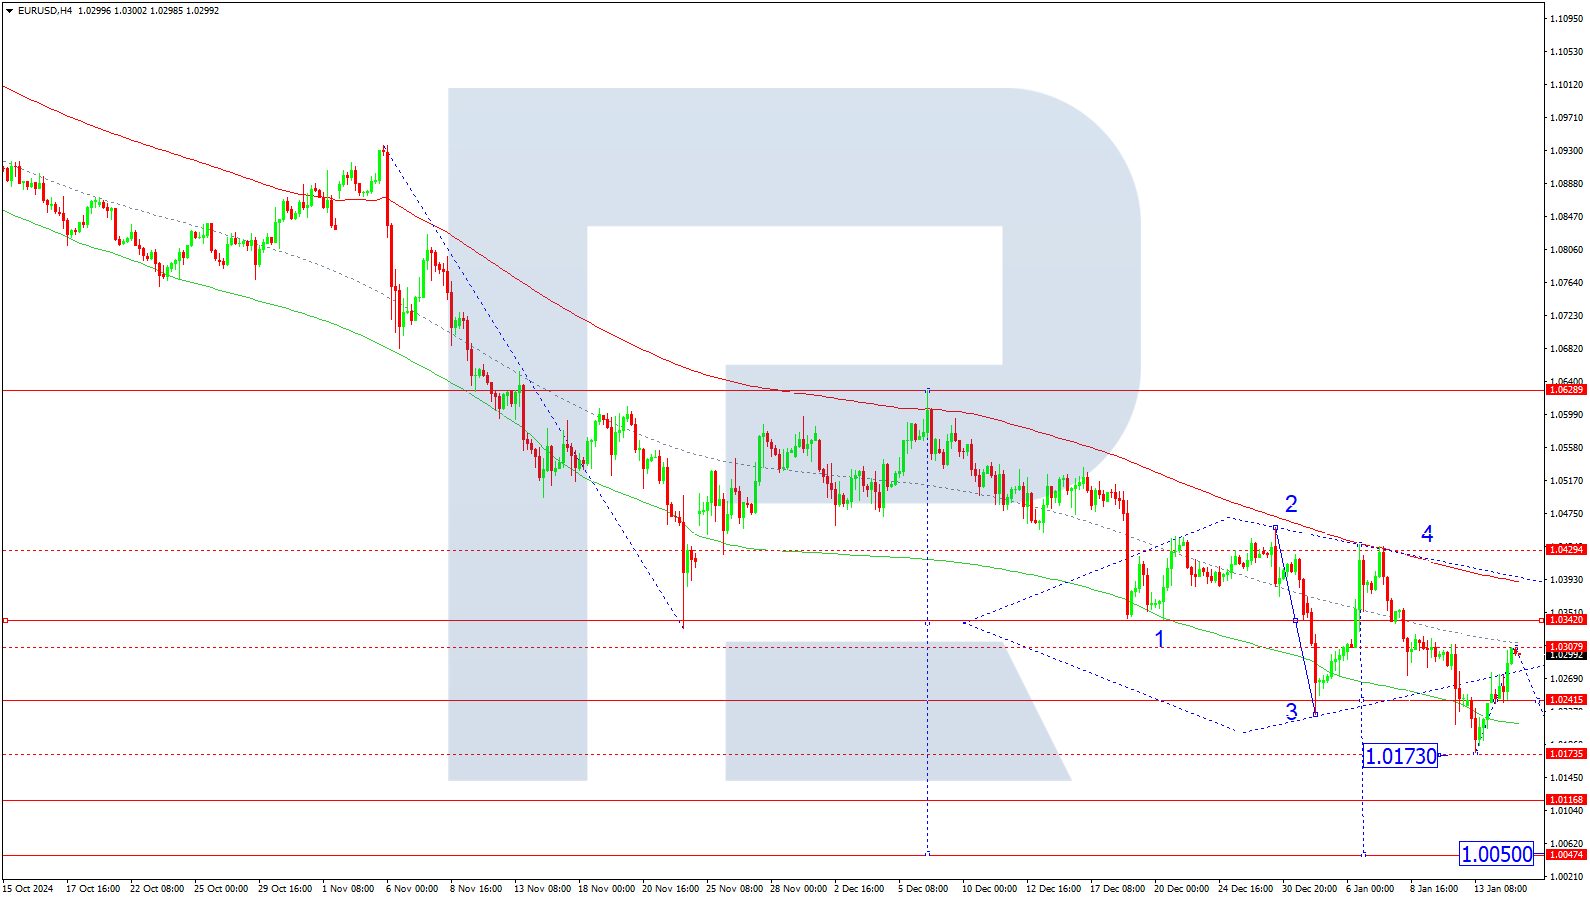
On the H4 chart, EURUSD completed an upward wave to 1.0307. On 15 January 2025, a decline to 1.0240 is anticipated, with the formation of a consolidation range around this level. A further extension downwards to 1.0173 is possible as the first target. Subsequently, growth back to 1.0240 is expected, followed by a downward wave to 1.0168, with the trend likely extending to 1.0050 as the main target.
Technically, this scenario aligns with the Elliott Wave structure and the fifth-wave downward matrix centred at 1.0300, which is key for EURUSD in this wave. Currently, the market is shaping a downward wave towards the lower boundary of the price Envelope at 1.0173. After hitting this level, the price may correct towards the central line of the Envelope at 1.0300.
Technical indicators for today’s EURUSD forecast suggest a potential decline to 1.0173.
USDJPY forecast
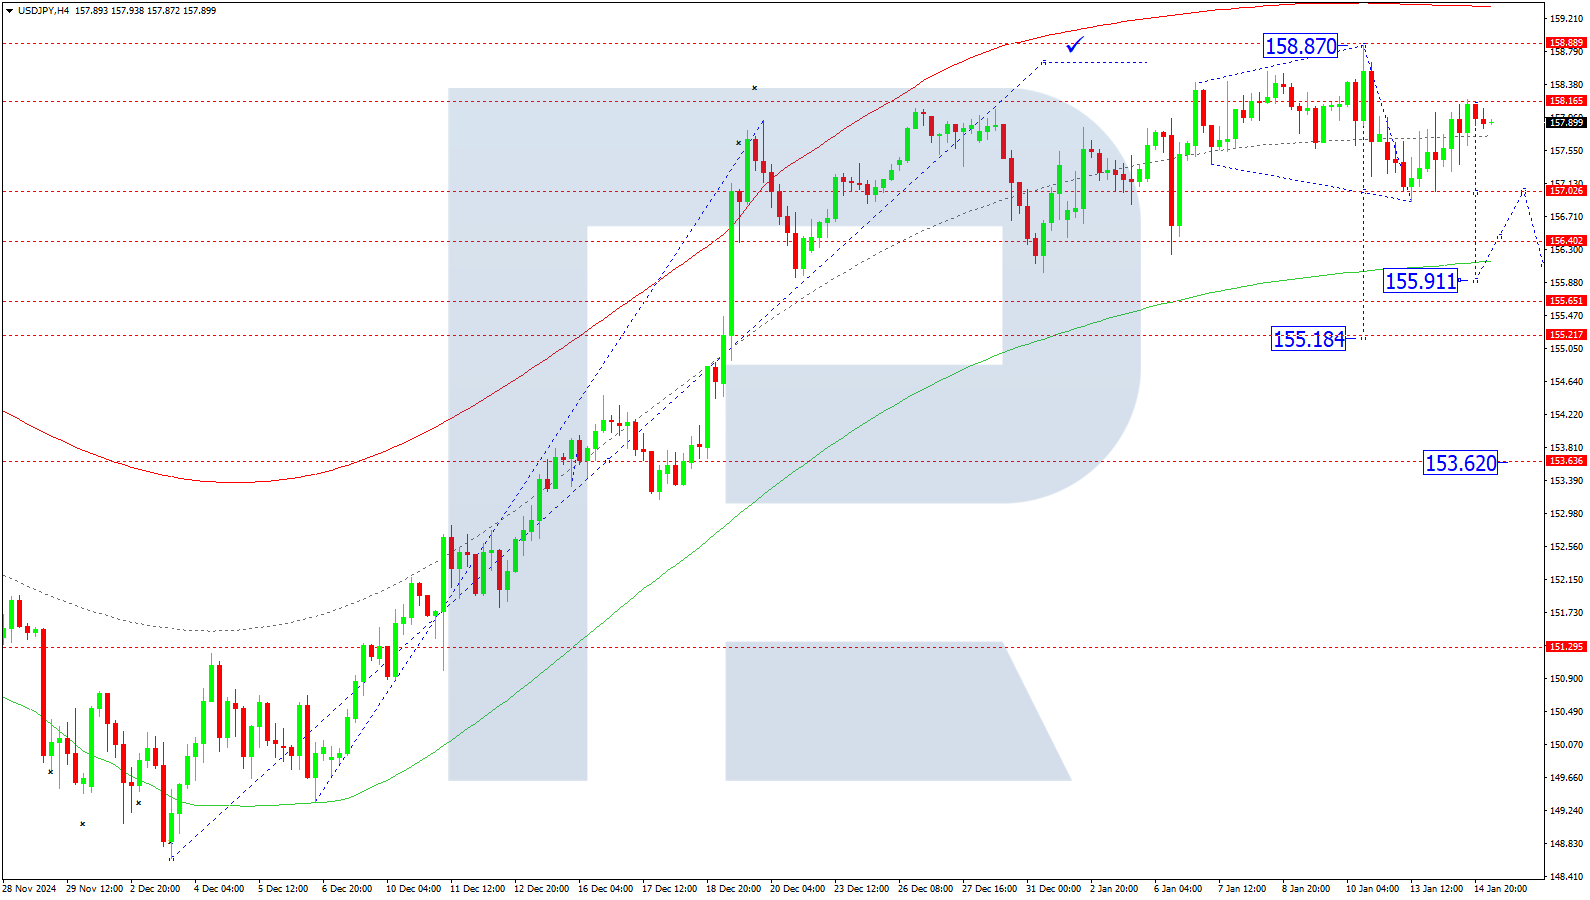
On the H4 chart, USDJPY executed an upward wave to 158.16. On 15 January 2025, the market formed a consolidation range above 157.00. A downward breakout could lead to a correction to 155.90. Subsequently, an upward wave to retest 157.00 from below is anticipated, followed by another decline to 155.90 and a potential upward move to 156.90.
Technically, this scenario reflects the Elliott Wave structure and correction matrix centred at 157.00. The market is near the central line of the price Envelope, with a potential move to its lower boundary at 155.90. An upward wave towards the central line at 157.00 may follow.
Technical indicators for today’s USDJPY forecast suggest a potential correction to 155.90.
GBPUSD forecast
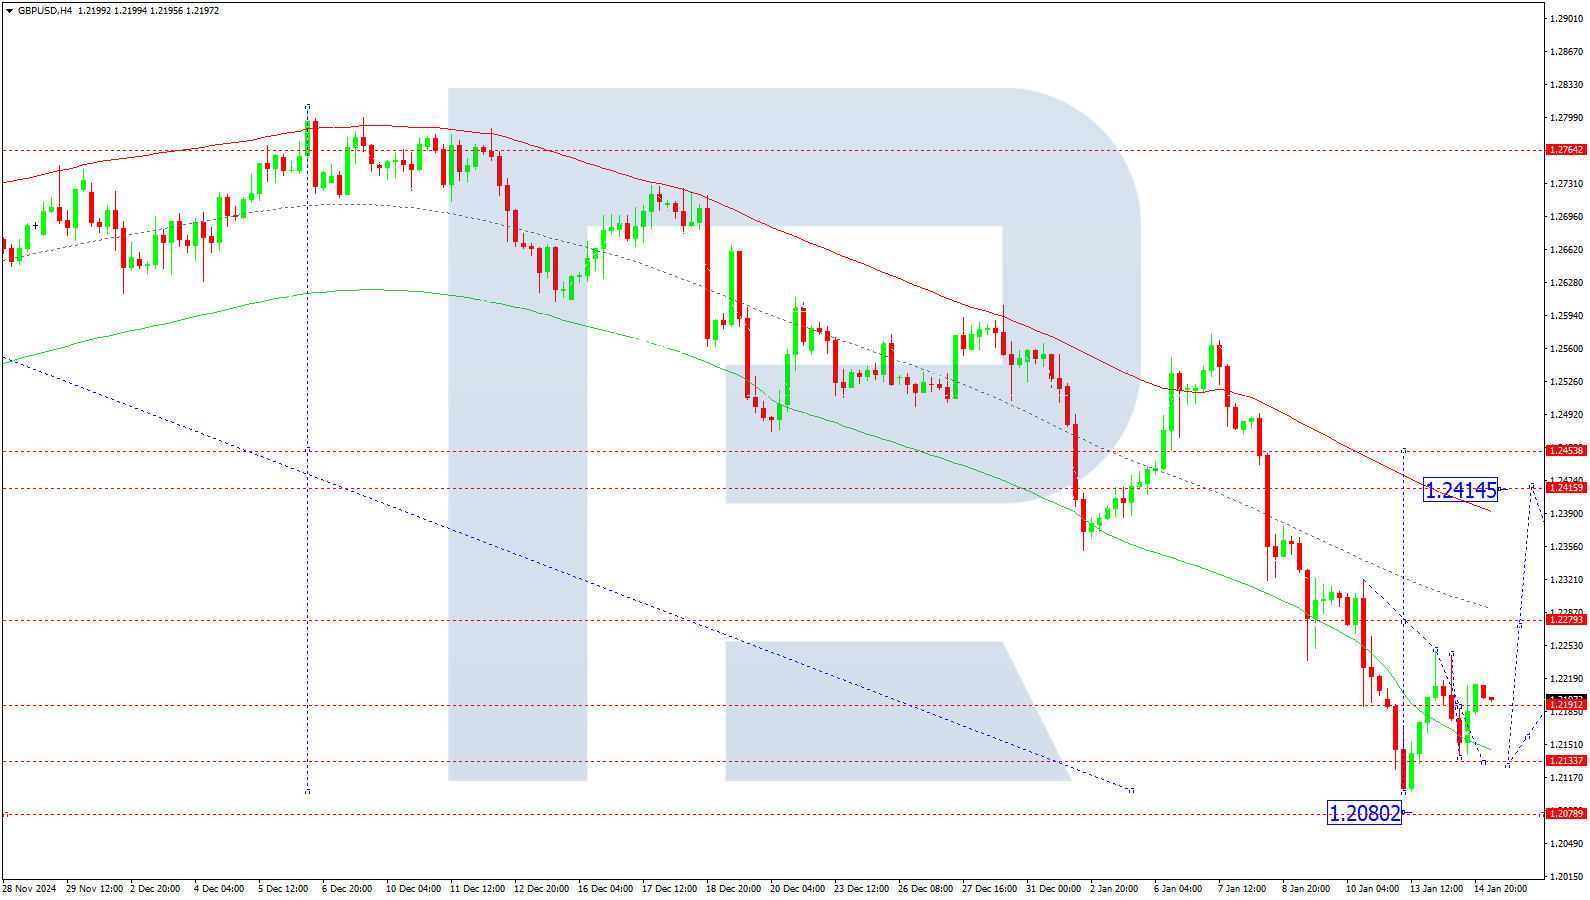
On the H4 chart, GBPUSD is consolidating around 1.2191. On 15 January 2025, a decline to 1.2134 is expected. A downward breakout could lead to a move to 1.2080, while an upward breakout might initiate a new growth wave to 1.2414 as a local target.
Technically, this scenario aligns with the Elliott Wave structure and the downward wave matrix centred at 1.2333. The market is consolidating near the lower boundary of the price Envelope. Growth to the central line at 1.2273 is anticipated, with further potential to reach the upper boundary at 1.2414.
Technical indicators for today’s GBPUSD forecast suggest the likelihood of a new upward wave to 1.2414.
AUDUSD forecast
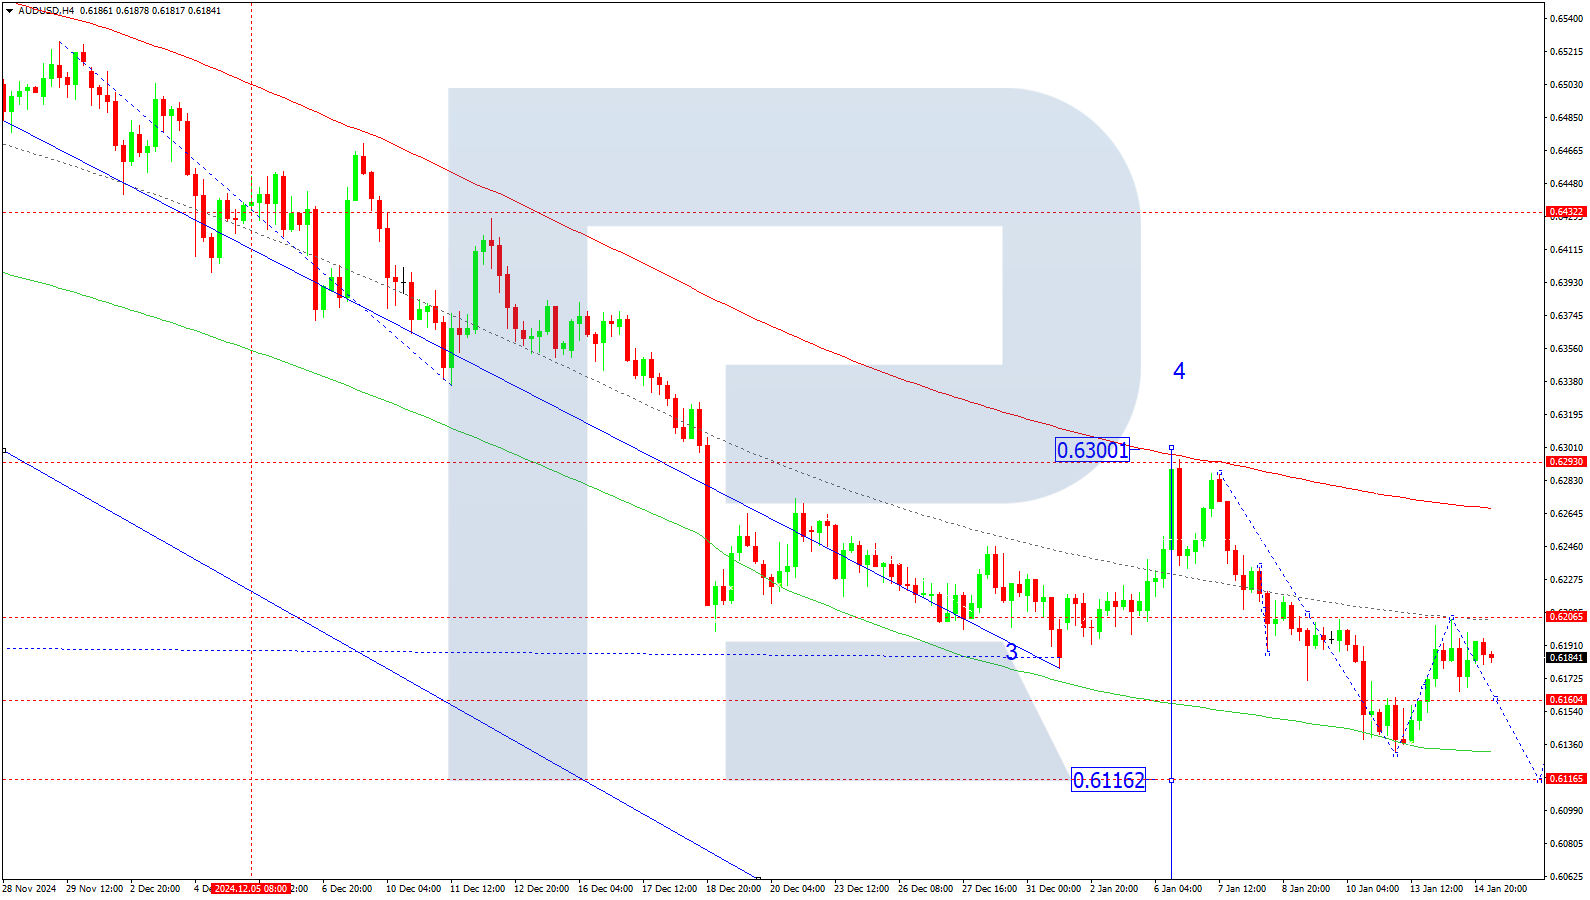
On the H4 chart, AUDUSD completed an upward wave to 0.6200. On 15 January 2025, a consolidation range below this level is expected. A downward breakout could lead to a move towards 0.6116, while an upward breakout might result in another growth structure to 0.6211. Subsequently, a decline to 0.6116 is anticipated.
Technically, this scenario aligns with the Elliott Wave structure and the downward wave matrix centred at 0.6211. The market reached the lower boundary of the price Envelope at 0.6132 and formed a growth wave to the central line at 0.6211. Subsequently, a decline towards the lower boundary at 0.6116 is expected.
Technical indicators for today’s AUDUSD forecast suggest a potential decline to 0.6116.
USDCAD forecast
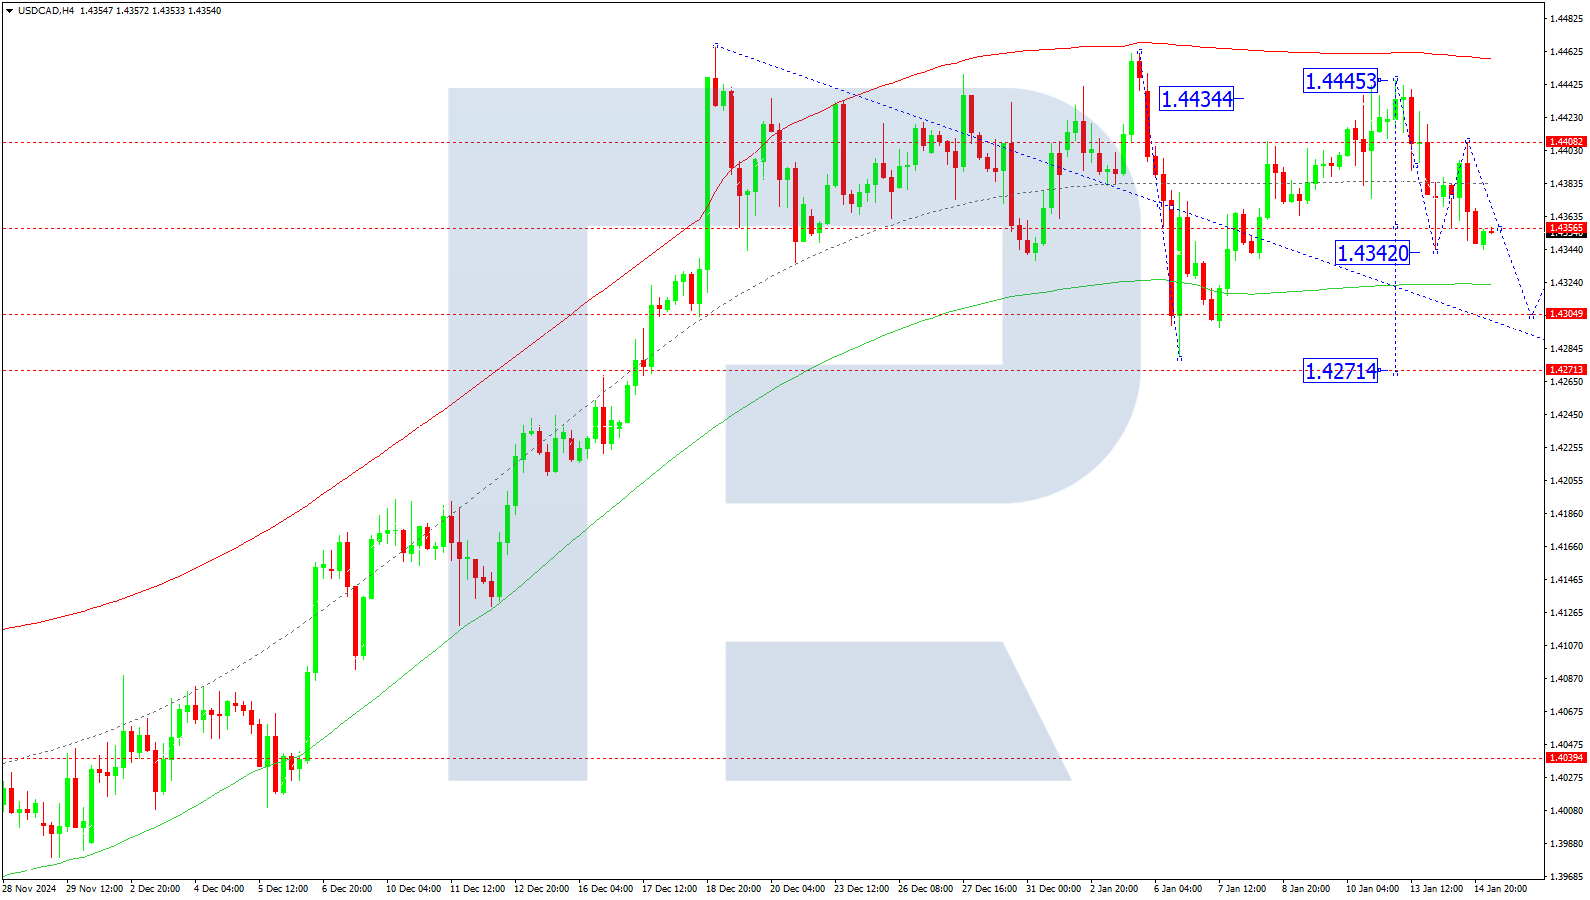
On the H4 chart, USDCAD executed a downward impulse to 1.4342, followed by a correction to 1.4408. On 15 January 2025, the market moved to 1.4355 and formed a narrow consolidation range around this level. A downward breakout could lead to a move to 1.4300, with the correction possibly extending to 1.4271.
Technically, this scenario aligns with the Elliott Wave structure and correction matrix centred at 1.4355, which is key for USDCAD in this wave. The market is heading towards the lower boundary of the price Envelope at 1.4317. After reaching this target, the price may rise towards the central line at 1.4300.
Technical indicators for today’s USDCAD forecast suggest a continuation of the downward wave to 1.4300.
XAUUSD forecast
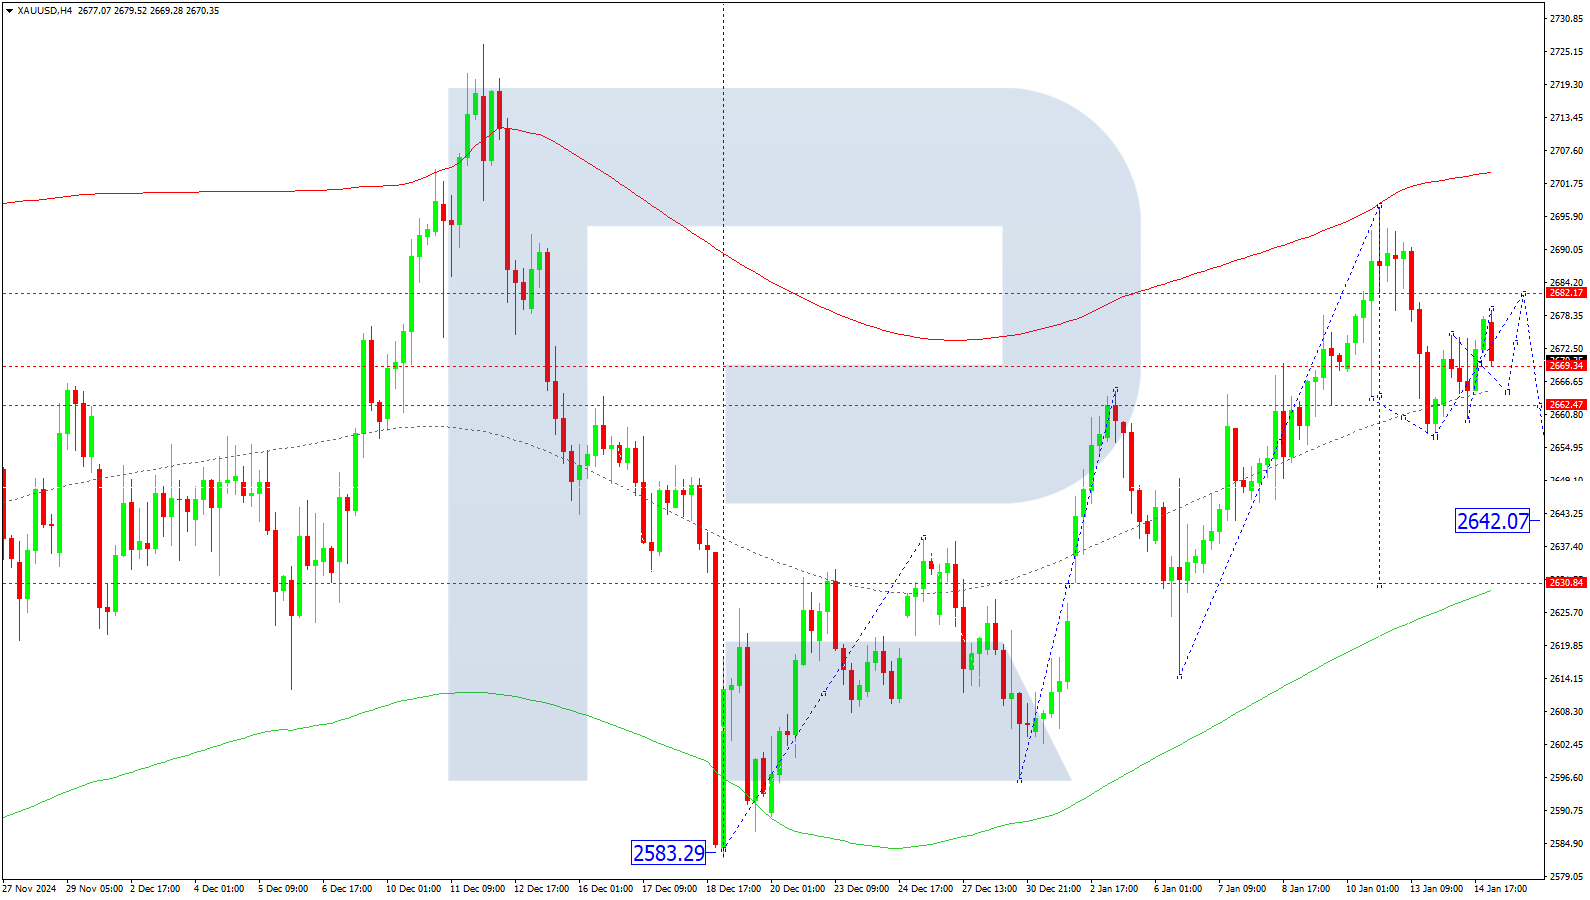
On the H4 chart, XAUUSD is consolidating around 2,669. On 15 January 2025, the consolidation range is expected to expand to 2,682. Subsequently, a decline to 2,642 as a local target is anticipated, followed by potential growth to 2,662 and a further decline to 2,630.
Technically, this scenario aligns with the Elliott Wave structure and growth wave matrix centred at 2,630. The market may move towards the lower boundary of the Envelope at 2,630. After reaching this level, the price could rise to the central line at 2,662.
Technical indicators for today’s XAUUSD forecast point to a potential decline to 2,642 and 2,630.
Brent forecast
On the H4 chart, Brent crude is consolidating around 79.73. On 15 January 2025, a decline to 78.75 is expected, with the wave potentially extending to 78.20 as the first target. A correction is also anticipated, with the main target at 76.30.
Technically, this scenario reflects the Elliott Wave structure and growth wave matrix centred at 76.30. The market is near the upper boundary of the price Envelope at 80.98. A downward correction to the lower boundary at 76.30 is possible today.
Technical indicators for today’s Brent forecast suggest a potential correction to 76.30.
Los pronósticos de los mercados financieros son la opinión personal de sus autores. El análisis actual no es una guía de trading. RoboForex no se hace responsable de los resultados que puedan ocurrir por utilizar las recomendaciones presentadas.

