US 500 analysis: downtrend to persist as weak US employment data pushes prices lower
The US 500 stock index is in a downtrend, pressured by weak US employment market indicators. US 500 analysis suggests that this decline will continue this week.
US 500 trading key points
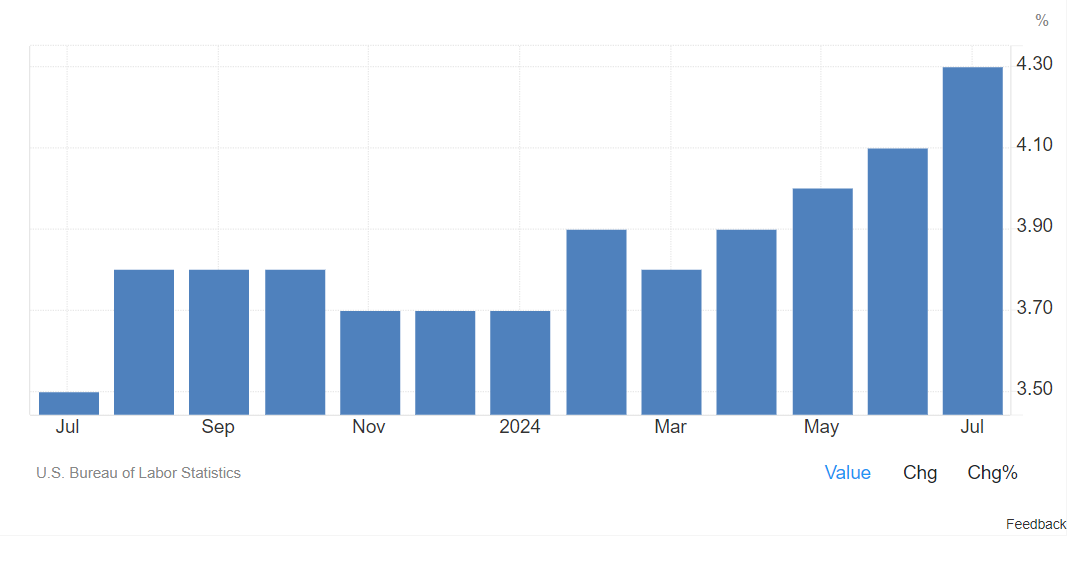
- Recent data: the US unemployment rate increased to 4.3% in July 2024, surpassing the forecasted 4.1%
- Economic indicators: a strong employment market had previously been a key factor in maintaining the US Federal Reserve’s elevated interest rates
- Market impact: stocks have declined further after a weak employment report, which has fuelled concerns that the Federal Reserve may be reducing interest rates too slowly
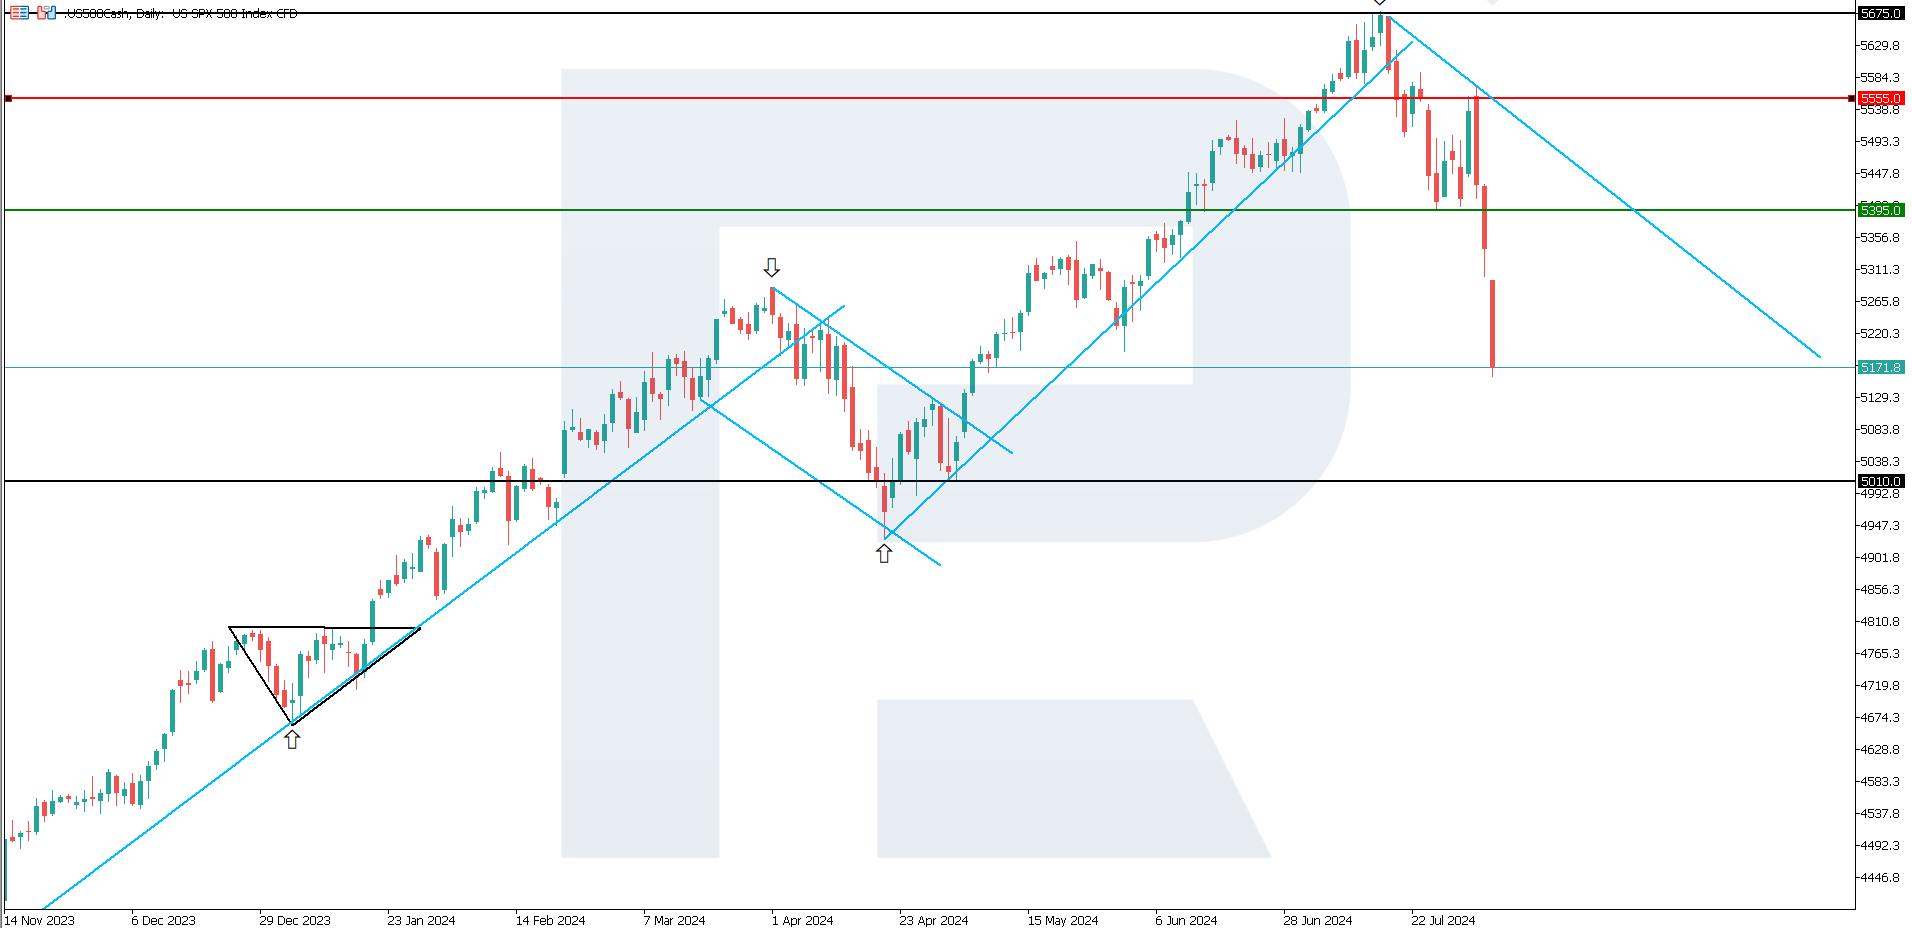
- Resistance: 5,555.0, Support: 5,395.0
- US 500 price forecast: 5,010.0
Fundamental analysis
The US employment market is cooling. The unemployment rate reached 4.3% in July, exceeding analysts’ expectations of 4.1%, marking the highest rate since October 2021. Market participants are concerned that the US Federal Reserve has made a mistake in maintaining the key rate at the highest level in 23 years.
Source: https://tradingeconomics.com/united-states/unemployment-rate
Employment data might prompt the US Federal Reserve to reduce the key rate more rapidly than market participants previously anticipated. This may lead to a sharp drop in government bond yields, which are also at their highest level in two decades. It is uncertain when investors can purchase US government bonds with such yields again.
As a result, prominent investors are rushing to acquire government bonds offering high current yields. However, unlike government bonds, stocks are expected to lag in response to the US Federal Reserve’s potential monetary policy easing. This dynamic is driving a sell-off in the stock market. Consequently, the US 500 forecast for next week is bearish.
US 500 technical analysis
The US 500 stock index is in a strong downtrend. The rather modest decline targets outlined in previous forecasts have already been reached. Given the current situation, a further decline or a sideways channel should be expected in the mid-term. An uptrend is highly unlikely to form.
Key levels to watch in the US 500 index forecast for next week include:
- Resistance level: 5,555.0 – a breakout above this level could drive the price to 5,675.0
- Support level: 5,395.0 – the price has broken below this level and falls further to the potential target at 5,010.0
Summary
The US 500 stock index is in a strong downtrend, with the next decline target at 5,010.0. A sell-off in the stock market is driven by investors’ desire to purchase US government bonds with the highest coupon yield, which may start falling once the US Federal Reserve cuts the interest rate due to a weak employment market.
Los pronósticos de los mercados financieros son la opinión personal de sus autores. El análisis actual no es una guía de trading. RoboForex no se hace responsable de los resultados que puedan ocurrir por utilizar las recomendaciones presentadas.


