US Tech analysis: investors pause ahead of inflation data
The US Tech stock index is in a strong uptrend and is poised for a new all-time high. More details in our US Tech price forecast and analysis for next week, 18-22 November 2024.
US Tech forecast: key trading points
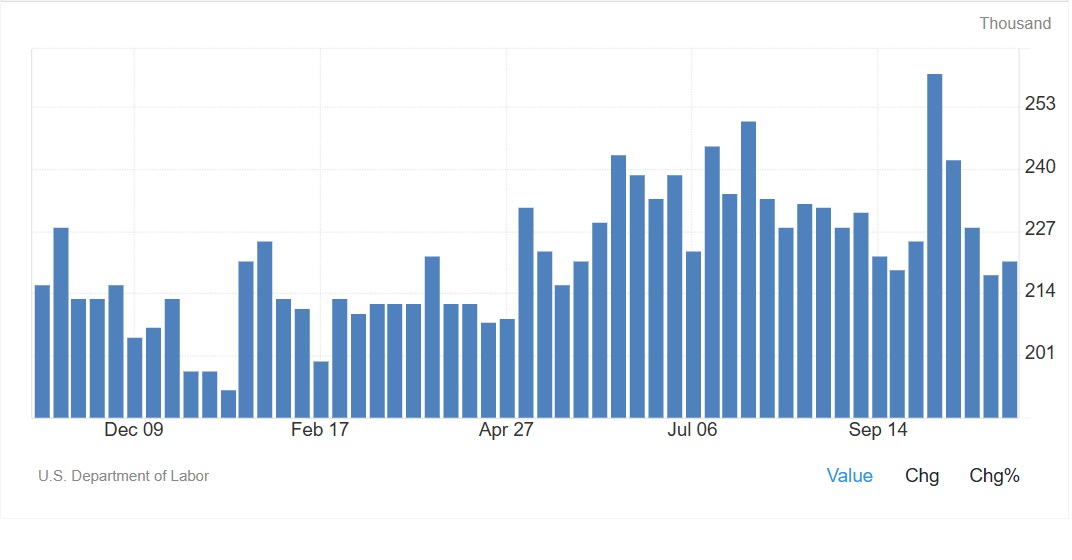
- Recent data: initial jobless claims totalled 221,000 over the reporting week
- Economic indicators: the indicator reflects the number of new claims for unemployment benefits during the reporting week
- Market impact: labour market indicators impact the US Federal Reserve monetary policy
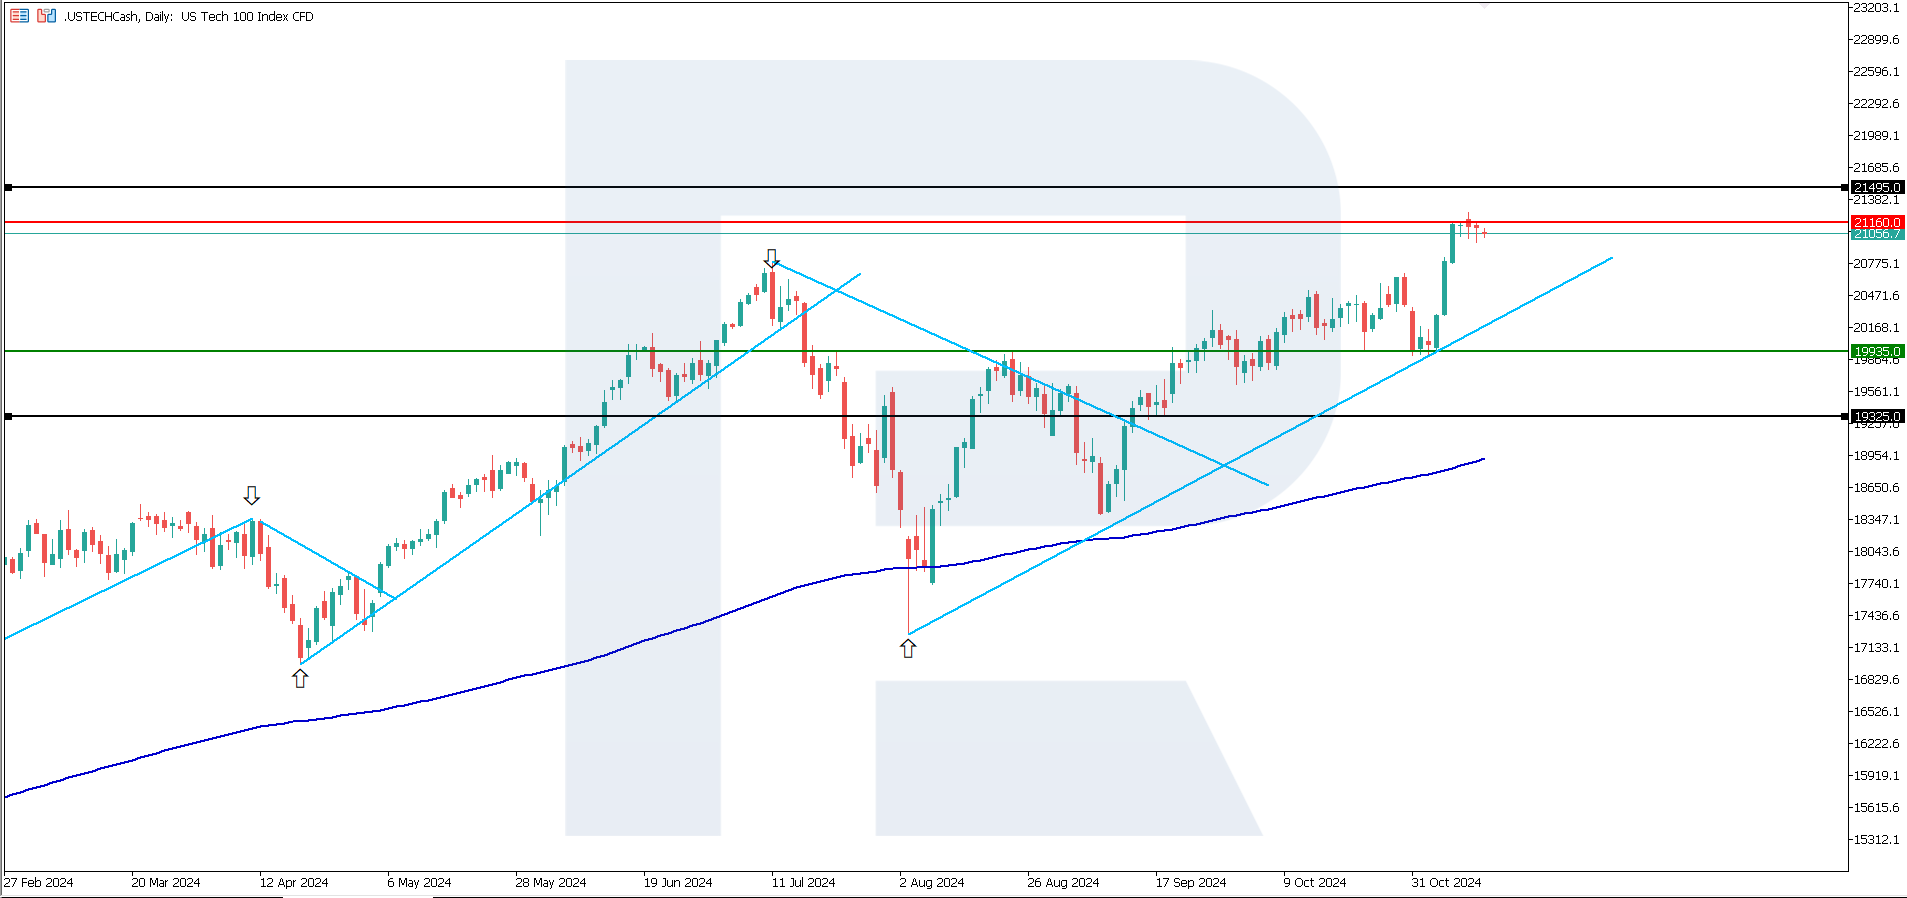
- Resistance: 21,160.0, Support: 19,935.0
- US Tech price forecast: 21,495.0
Fundamental analysis
Although claims rose from 218,000 to 221,000, this result was still below expectations, indicating a stable labour market. There was no sharp rise in claims, which would signal potential economic challenges. As one of the critical economic indicators, it reflects the health of the labour market and is essential for assessing the current state of the US economy.
Source: https://tradingeconomics.com/united-states/jobless-claims
An indicator that aligns with or falls below expectations suggests a stable labour market and resilient economy, typically positive for the stock market. This indicator may drive up stock prices, particularly in sectors sensitive to economic cycles, such as the consumer and banking sectors. Only inflation data can change positive investor sentiment.
Federal Reserve Bank of Minneapolis President Neel Kashkari stated he would scrutinise incoming inflation data to assess whether another interest rate cut at the US Federal Reserve’s December meeting is justified. He said only exceptional inflation data would prompt a revision of plans to reduce the key rate. The US Tech index forecast is moderately positive
US Tech technical analysis
The US Tech stock index remains in a steady uptrend with the potential to reach a new all-time high. The current correction is short-term. From a technical analysis perspective, the US Tech index will likely break above the 21,160.0 resistance level and continue its upward trajectory towards the next target at 21,495.0.
The following scenarios are considered for the US Tech price forecast:
- Pessimistic US Tech forecast: a breakout below the 19,935.0 support level could see the index fall to 19,325.0
- Optimistic US Tech forecast: a breakout above the 21,160.0 resistance level could drive the index up to 21,495.0
Summary
Although initial jobless claims rose from 218,000 to 221,000, the result was below expectations. An indicator that meets or falls below expectations suggests a stable labour market and resilient economy. Investors are awaiting inflation data, which may impact the US Federal Reserve’s decision to lower the interest rate in December 2024.
Los pronósticos de los mercados financieros son la opinión personal de sus autores. El análisis actual no es una guía de trading. RoboForex no se hace responsable de los resultados que puedan ocurrir por utilizar las recomendaciones presentadas.


