
EURUSD strengthens as market rate expectations shift
The EURUSD pair is correcting after Friday’s rise but maintains upward momentum thanks to improving eurozone economic indicators. The rate currently stands at 1.1530. For more details, see our analysis for 3 August 2026.
EURUSD forecast: key takeaways
- Eurozone GDP grew by 0.4% in Q2, exceeding market expectations
- The likelihood of an ECB rate hike in September has increased, supporting the European currency
- EURUSD forecast for 3 August 2026: 1.1665
Fundamental analysis
The EURUSD pair entered a correction after Friday’s strong rally, although buyers still have the upper hand. The pair confidently broke above the key 1.1480 resistance level, further signalling the completion of the Double Bottom reversal pattern on the daily chart.
The euro was supported by fresh eurozone macroeconomic data, which was significantly stronger than market expectations. The eurozone economy unexpectedly showed a higher growth rate than the US economy, with eurozone GDP up 0.4% in Q2, recording its best result since the beginning of 2025.
Preliminary eurozone inflation data further supported the euro. The HICP accelerated to 2.9% year-on-year in July. Persistent inflationary pressure increases the likelihood that the ECB may consider further monetary policy tightening at its September meeting, providing local support for the European currency.
Meanwhile, the US dollar remains under pressure after the Federal Reserve decided to keep interest rates unchanged. A speech by Federal Reserve Chairman Kevin Warsh did not provide hawkish signals regarding future rate hikes, leading to lower market expectations. The likelihood of a September rate hike fell from 80% to 64%, intensifying the sell-off in the US currency.
Technical outlook
The EURUSD pair rebounded from the upper boundary of the descending channel, with buyers gaining a foothold above the EMA-65, indicating continued bullish momentum in the short term. Today’s EURUSD forecast suggests a resumption of the upward move, with a potential target at 1.1665.
The Stochastic Oscillator analysis further supports continued growth. The oscillator values have consolidated above the resistance line, indicating increased buying pressure and continued positive momentum. A breakout above the upper boundary of the descending channel, followed by firm consolidation above the 1.1565 resistance level, would confirm the bullish scenario. In this case, buyers may gain additional momentum to extend the upward move.
However, an alternative scenario remains possible. If sellers regain control of the market and break below the lower boundary of the upward correction, followed by consolidation below the 1.1455 support level, this would signal weakening bullish pressure. In this case, the EURUSD rate could resume its decline towards the nearest target at 1.1365.
EURUSD overview
- Asset: EURUSD
- Timeframe: H4 (intraday)
- Trend: bullish momentum
- Key resistance levels: 1.1565 and 1.1615
- Key support levels: 1.1480 and 1.1425
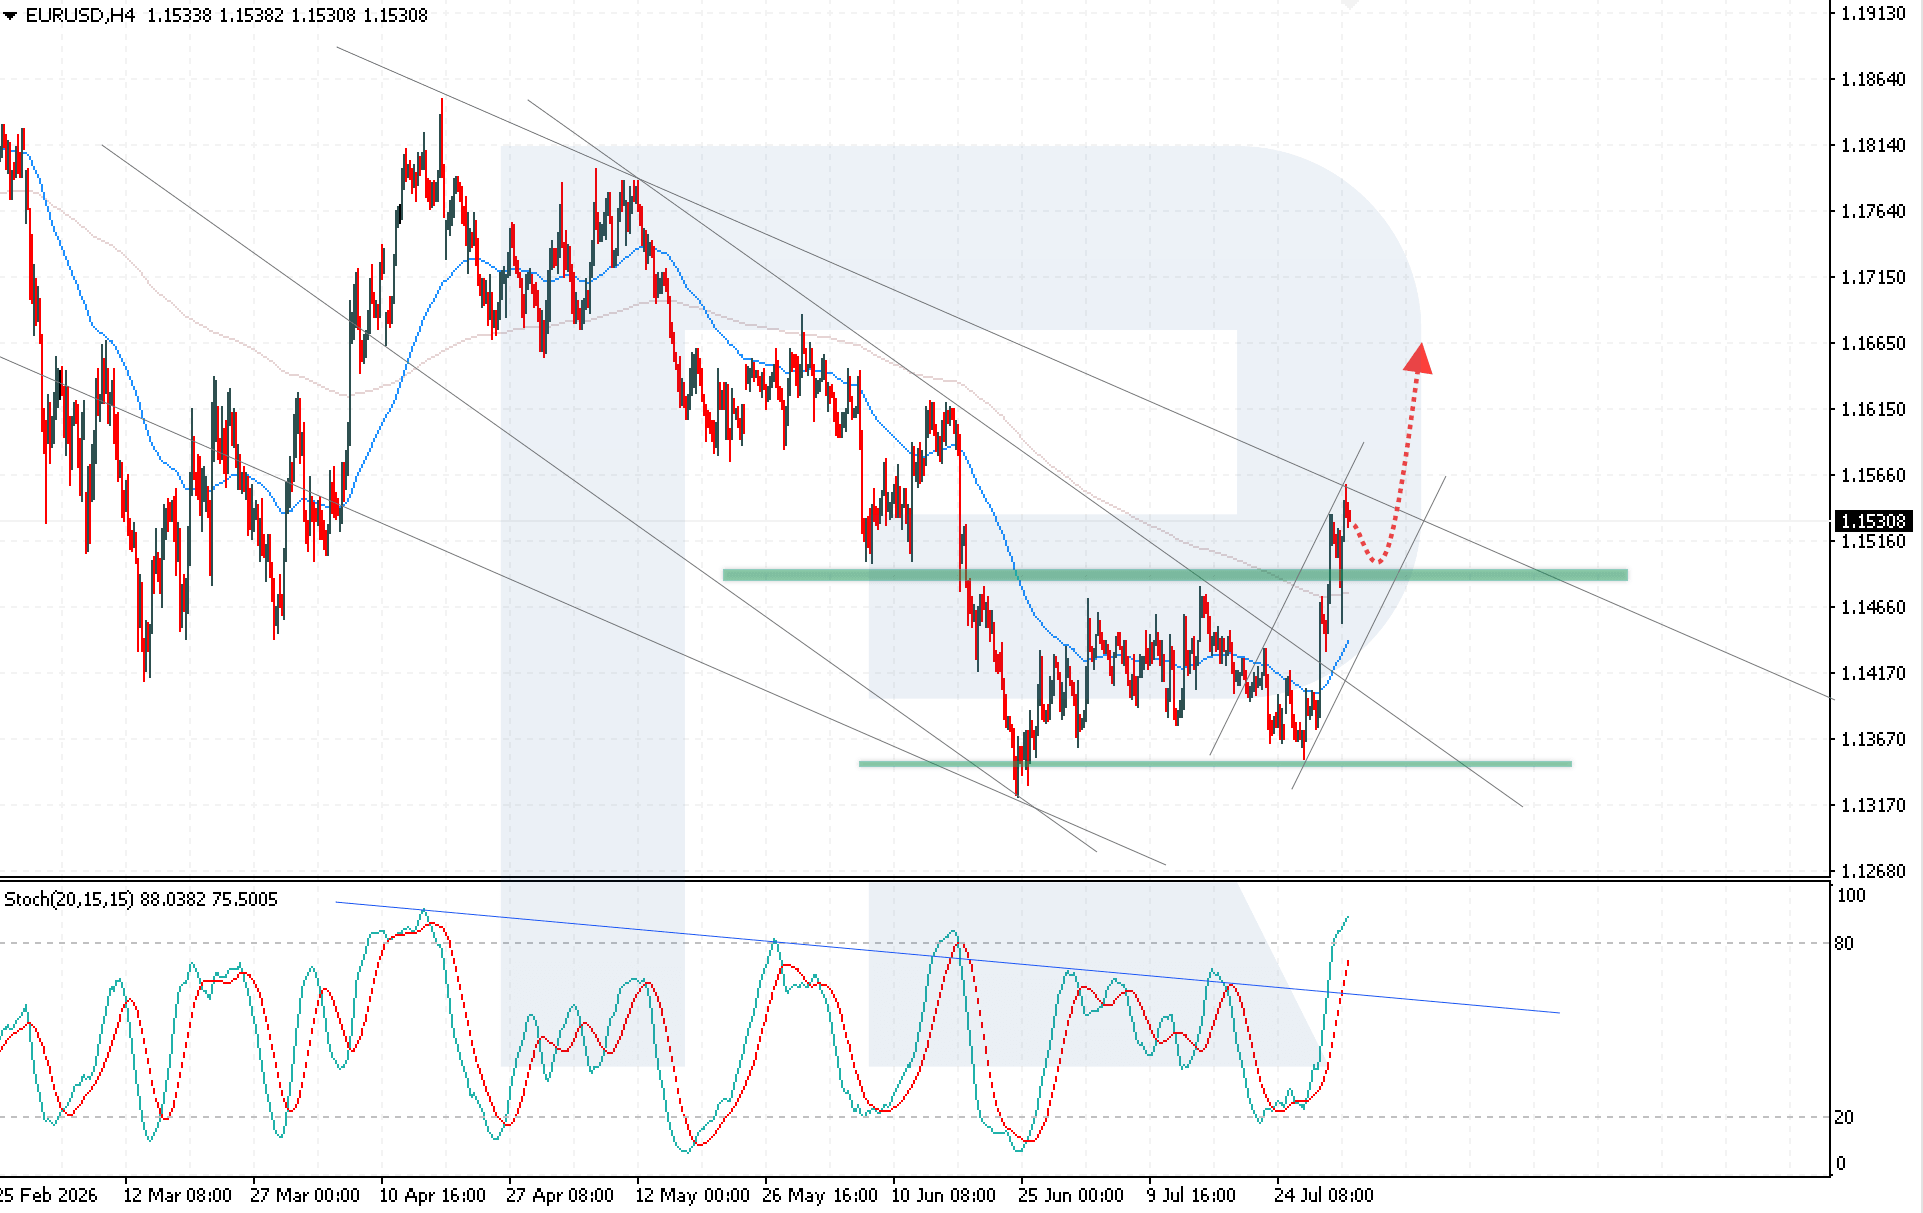
EURUSD trading scenarios for today
Main scenario (Buy Stop)
A breakout above the upper boundary of the descending channel and consolidation above 1.1565 would create conditions for increased buying pressure.
- Take Profit: 1.1665
- Stop Loss: 1.1515
Alternative scenario (Sell Stop)
A breakout below the lower boundary of the bullish channel and consolidation below 1.1480 would indicate weakening buying pressure and a continued decline in the EURUSD rate.
- Take Profit: 1.1345
- Stop Loss: 1.1505
Risk factors
The main risk to the EURUSD bullish scenario is buyers’ failure to remain above 1.1480, which could increase selling pressure. A stronger US dollar amid changing expectations for Federal Reserve policy would be an additional risk factor.
Summary
The EURUSD pair maintains bullish momentum after breaking above the key resistance level and amid an improving fundamental backdrop for the euro. If the price holds above 1.1480, buyers could continue the move towards 1.1665.
Editors’ picks

EURUSD forecast 2026–2027: technical analysis, price levels & predictions
EURUSD has pulled back from the 2026 high of 1.1915 and is now trading near 1.1450 — below both EMA65 and EMA200 — with the active scenario shifting from bullish to bearish. The ECB raised rates to 2.40%, but the Fed holds at 3.75%, and US inflation (3.5%) continues to outpace the eurozone (2.8%). A confirmed break below 1.1280 opens the next downward wave toward 1.1080. We break down the key levels, three trading scenarios with entry triggers, and what Deutsche Bank, Morgan Stanley and UBS are forecasting for EURUSD in 2026.

Gold (XAUUSD) forecast 2026: predictions based on fundamental and technical analysis
Gold has corrected over 25% from its all-time high of 5,597 USD and is now trading near 4,100 USD — testing a critical support zone. Is this the bottom, or will the downtrend continue? We break down the key levels (support 3,920 USD, breakout trigger 4,500 USD), three trading scenarios with entry levels, and what J.P. Morgan, Goldman Sachs and Deutsche Bank are forecasting for gold in 2026.
Ang mga pagtataya na ipinakita sa seksyong ito ay nagpapakita lamang ng pribadong opinyon ng may-akda at hindi dapat ituring bilang gabay para sa pagtetrade. Walang pananagutan ang RoboForex para sa mga resulta ng pagtetrade batay sa mga rekomendasyon sa pagtetrade na inilarawan sa mga analytical review na ito.