
EURUSD under pressure as geopolitics revives inflation risks
The EURUSD pair has fallen to 1.1578, with markets broadly pricing in the Federal Reserve maintaining a hawkish policy stance. Discover more in our analysis for 2 September 2026.
EURUSD forecast: key takeaways
- The EURUSD pair remains under pressure as demand for the US dollar continues to strengthen
- The market expects Federal Reserve monetary policy to remain hawkish for an extended period
- EURUSD forecast for 2 September 2026: 1.1555
Fundamental analysis
The EURUSD rate fell to 1.1578 on Wednesday. The US dollar is supported by high bond yields and rising oil prices, which are fuelling expectations that the Federal Reserve will maintain a hawkish policy stance.
Amid a global sell-off in debt securities, the yield on 10-year US Treasuries rose towards 4.80%, its highest level since early 2025. At the same time, the escalation of the conflict between the US and Iran pushed oil prices higher and increased concerns about renewed energy supply disruptions and more persistent inflation.
US economic data is sending mixed signals. JOLTS job openings fell to 7.27 million in July, below expectations, while the ISM manufacturing PMI declined from 55.6 to 54.6 in August. Despite the drop, the indicator remains comfortably above 50, signalling continued growth in the manufacturing sector.
Market attention is now shifting to the ADP report and Friday’s Nonfarm Payrolls, which could adjust expectations for the Federal Reserve rate outlook. Strong employment data could provide additional support for the US dollar and bond yields.
At the same time, the US fiscal situation remains a medium-term risk for the US dollar. Rising debt servicing costs could gradually increase the term premium on US Treasuries and make the US dollar more sensitive during periods of heightened concern about the sustainability of public finances.
The EURUSD outlook is moderately negative.
Technical outlook
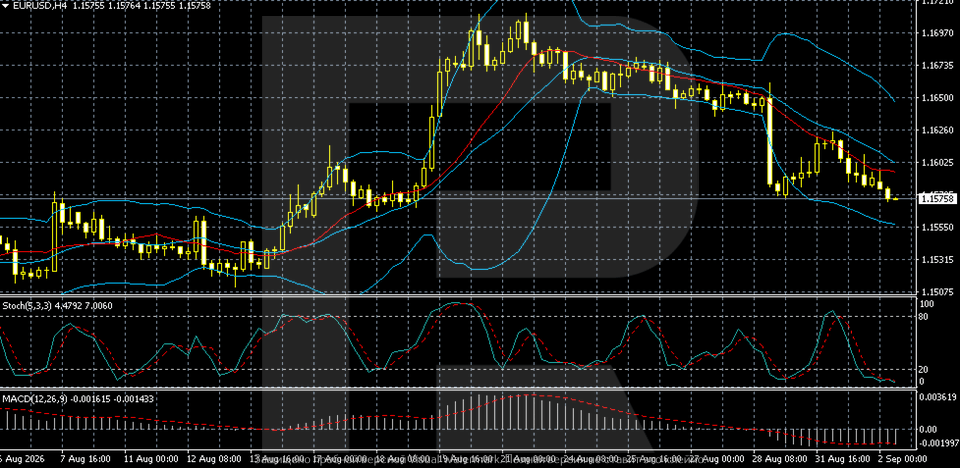
On the H4 chart, the EURUSD pair maintains its pronounced downward momentum. After failing to hold above 1.1625, the pair resumed its decline, currently trading around 1.1576 near the lower Bollinger Band. The nearest support level is located at 1.1555, with the next ones at 1.1530 and 1.1508. The resistance level lies at 1.1603, followed by the 1.1625–1.1650 zone. As long as the price remains below 1.1603, sellers retain the short-term advantage.
MACD remains in negative territory, confirming continued bearish momentum. The Stochastic Oscillator has moved deep into oversold territory, so a local rebound from current levels is possible, but there is still no clear reversal signal. The baseline scenario remains trading within the 1.1555–1.1603 range with a neutral-to-negative bias.
EURUSD overview
- Asset: EURUSD
- Timeframe: H4 (intraday)
- Trend: bearish
- Key resistance levels: 1.1603 and 1.1650
- Key support levels: 1.1555 and 1.1508
EURUSD trading scenarios for today
Main scenario (Sell Stop)
A breakout and consolidation below the 1.1555 support level would confirm continued downward momentum and create conditions for a further decline in the EURUSD rate.
- Current price: 1.1578
- Entry level: 1.1554
- Stop loss: 1.1578
- Take profit: 1.1508
- Risk-to-reward ratio: around 1:1.9
Alternative scenario (Buy Stop)
Consolidation above the 1.1603 resistance level would indicate easing selling pressure and open the way for a corrective recovery.
- Entry level: 1.1604
- Stop loss: 1.1579
- Take profit: 1.1650
- Risk-to-reward ratio: around 1:1.8
The trade idea is valid until 8:00 AM on 3 September 2026 (server time, UTC+3).
Risk factors
The main risk to the EURUSD downside scenario remains weak US labour market data or easing tensions in the Middle East, which could reduce inflation concerns and lower expectations of a hawkish Federal Reserve stance. At the same time, high US Treasury yields, elevated oil prices, and strong ADP or Nonfarm Payrolls data could continue to support the US dollar and add to pressure on the pair.
Summary
The EURUSD rate could slip lower. The EURUSD forecast for today, 2 September 2026, expects the pair to trade within the 1.1555–1.1603 range, with downside risks remaining.
Editors’ picks

EURUSD forecast 2026–2027: technical analysis, price levels & predictions
EURUSD has recovered from the July lows and is trading near 1.1545 — back in bullish territory. The pair has reclaimed EMA65 on the daily, formed a bullish EMA crossover on H4, and the US-eurozone GDP gap has narrowed sharply (US 1.5% vs eurozone 1.0%). Goldman Sachs and Deutsche Bank both now target 1.2500 by year-end. A confirmed close above 1.1700 opens the path to 1.1805. We break down the key levels, three trading scenarios, and what the unprecedented 9-3 FOMC dissent vote means for EURUSD.

Gold (XAUUSD) forecast 2026: technical analysis, price levels & predictions
Gold has reversed its downtrend and is trading near 4,360 USD, back above both EMA65 and EMA200. ETF flows turned positive in July with 3 billion USD of net inflows, and central banks bought 288.9 tonnes in Q2 — up 62% year-on-year. A breakout above 4,500 USD opens the path to 4,855 USD and the 5,597 USD all-time high. We break down the key levels, three trading scenarios with entry triggers, and what J.P. Morgan, Deutsche Bank and Goldman Sachs are forecasting for gold in 2026.
Ang mga pagtataya na ipinakita sa seksyong ito ay nagpapakita lamang ng pribadong opinyon ng may-akda at hindi dapat ituring bilang gabay para sa pagtetrade. Walang pananagutan ang RoboForex para sa mga resulta ng pagtetrade batay sa mga rekomendasyon sa pagtetrade na inilarawan sa mga analytical review na ito.