
EURUSD weekly forecast: US dollar pressure intensifies ahead of NFP
EURUSD opens the week near 1.1375 after four consecutive sessions of US dollar gains. The pair has fallen towards the July–September ascending trendline, while the US Dollar Index has risen above 101 and reached a near two-month high.
The new week will show whether this support can halt the decline ahead of key US data.
EURUSD forecast for this week: quick overview
- Market focus: the main event of the week of 28 September–2 October will be a new batch of US labour market data, culminating in Friday's employment report. Following the Federal Reserve's September rate hike, the market estimates the probability of another move in October at around 67%. A strong employment report would reinforce the case for further tightening and support the US dollar. A pronounced cooling in the labour market, by contrast, would reduce investor confidence in an October rate hike.
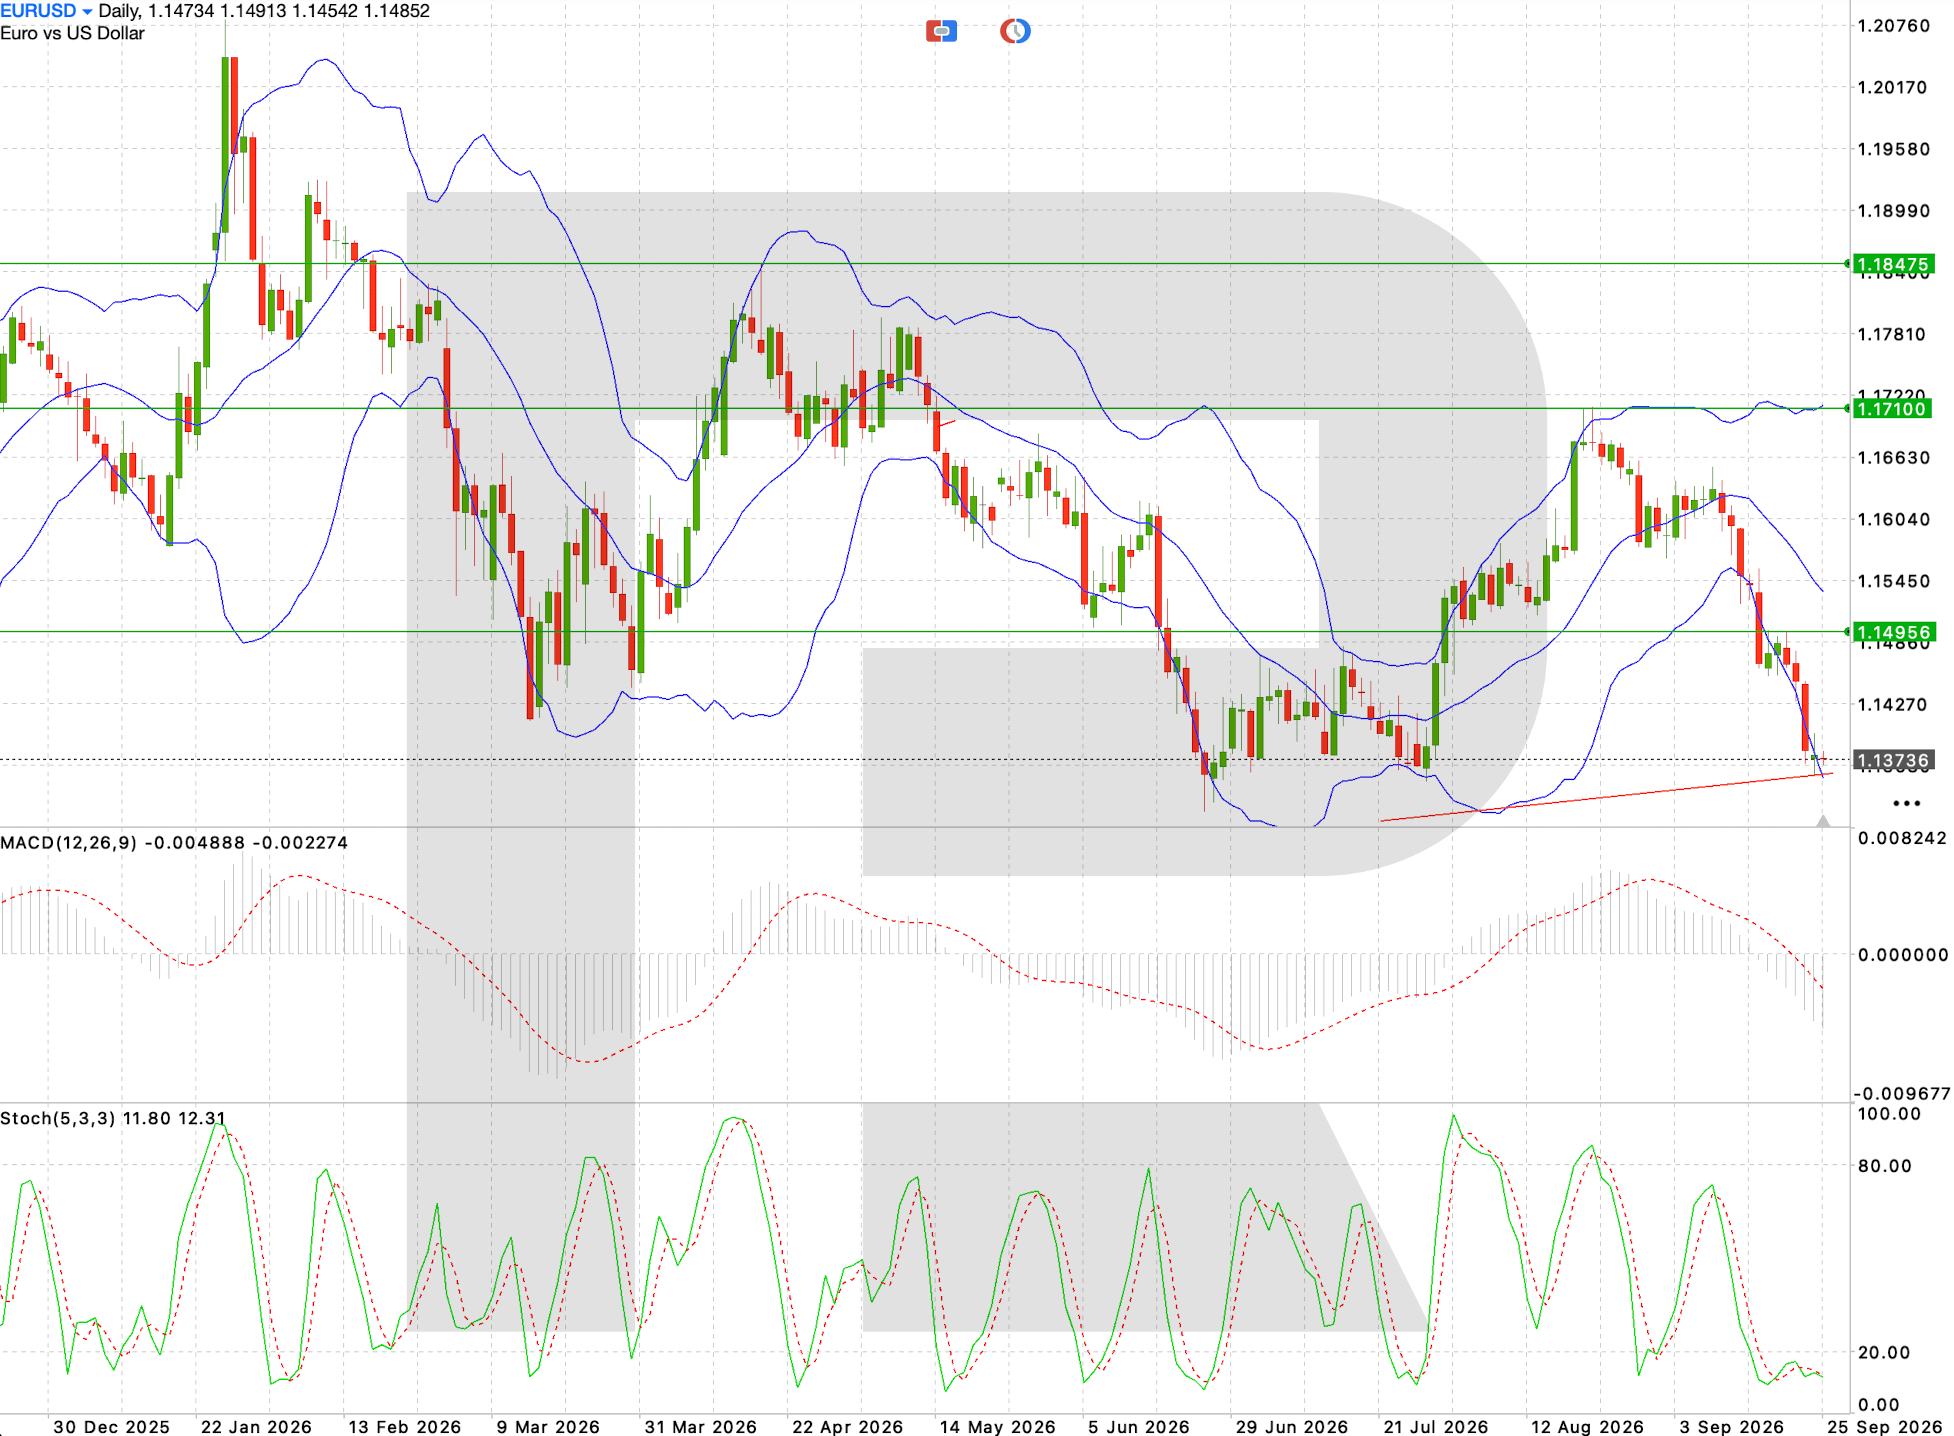
- Current trend: on the daily chart, EURUSD maintains strong downward momentum. The price broke below the 1.1495 area and fell towards 1.1370, where the ascending support line from the summer lows is located. MACD is below zero and continues to decline, confirming sellers' advantage. The Stochastic Oscillator has fallen to around 12 points and is deep in oversold territory. This increases the likelihood of a local rebound, but does not yet signal a reversal of the main short-term trend.
- Weekly forecast: the baseline scenario assumes continued pressure on EURUSD if the 1.1360–1.1370 zone is broken. In that case, the market would move decisively below the ascending trend support and gain room to decline towards 1.1300 and beyond. While this zone holds, an upward correction remains possible. For a noticeable improvement in the short-term picture, buyers need to push the pair back above 1.1495.
EURUSD key levels for next week
The US dollar enters the new week from a position of strength: the DXY Index has risen above 101 and closed higher for a second consecutive week. The US currency is being supported by both resilient macroeconomic data and concerns that elevated oil prices will continue to sustain inflation.
Following the September rate hike, the Federal Reserve has so far given no indication that the tightening cycle is close to ending. New York Fed President John Williams said the regulator still has significant work to do to bring inflation under control, while Philadelphia Fed's Anna Paulson suggested that further moderate tightening may be necessary.
The labour market also remains resilient for now. Initial jobless claims unexpectedly fell to 197,000, the lowest level in around two months. This indicates that higher rates have not yet led to a sharp deterioration in demand for workers.
As a result, the fundamental balance remains in favour of the US dollar. To change this picture, the market will need clearer signs of cooling in the US economy, particularly in employment.
EURUSD technical analysis
On the daily chart, EURUSD has formed a sequence of lower highs and lower lows following the August rise towards the 1.1700 area. A break below support at 1.14956 strengthened the downward structure and brought the price directly to the ascending trendline around 1.1360–1.1370.
The nearest resistance is now located at 1.14956. Above this are 1.1600–1.1610 and the more significant 1.17100 area. Support is provided by the current 1.1360–1.1370 zone, below which the next targets are 1.1300 and the area of previous lows.
The price is moving along the lower Bollinger Band, confirming the strength of the current momentum but at the same time indicating an extended decline. MACD continues to move deeper into negative territory. The Stochastic Oscillator is below 20, with both lines remaining near the bottom of the range.
The technical structure therefore remains bearish, but opening short positions directly at the current support is risky: the market needs to confirm a break below it.
EURUSD trading scenario for next week
EURUSD has approached strong trend support while deeply oversold, so entering at the current price carries the risk of a corrective rebound. Selling becomes relevant only after a confirmed break below this area.
Sell scenario
A break below 1.1360 would confirm that EURUSD has moved below the ascending trendline and that the downward structure remains intact.
- Entry level: sell stop 1.1358
- Take profit: 1.1285
- Stop loss: 1.1400
- Risk-to-reward ratio: approximately 1:1.7
The trade idea is valid until 2 October 2026.
If EURUSD holds above 1.1360, the trade idea will not be activated.
Summary
EURUSD maintains strong downward momentum and is testing key trend support after another round of US dollar strength. The EURUSD forecast for 28 September–2 October suggests further declines if 1.1360 is broken, with the nearest target at 1.1285.
Editors’ picks

EURUSD forecast 2026–2027: technical analysis, price levels & predictions
The EURUSD outlook for 2026 and 2027: key levels on the daily chart, three trading scenarios and the policy gap between the Fed and the ECB that drives the pair.

Gold (XAUUSD) forecast 2026: technical analysis, price levels & predictions
Where gold could trade in 2026: key levels, three trading scenarios with entry triggers and the forecasts from J.P. Morgan, Deutsche Bank and Goldman Sachs.
Ang mga pagtataya na ipinakita sa seksyong ito ay nagpapakita lamang ng pribadong opinyon ng may-akda at hindi dapat ituring bilang gabay para sa pagtetrade. Walang pananagutan ang RoboForex para sa mga resulta ng pagtetrade batay sa mga rekomendasyon sa pagtetrade na inilarawan sa mga analytical review na ito.