
USDJPY pauses near 40-year highs
The USDJPY pair continues to trade sideways in anticipation of triggers for further movement, with the price hovering around 162.10. Find out more in our analysis for 16 July 2026.
USDJPY forecast: key takeaways
- Expectations of an imminent Federal Reserve rate hike have declined
- Japan’s Ministry of Finance may carry out another unexpected intervention
- USDJPY forecast for 16 July 2026: 161.65 or 162.83
Fundamental analysis
Fundamental analysis for 16 July 2026 shows that the pair remains in the 162.00–162.20 area, hovering near its highest levels in almost 40 years. Despite the recent weakening of the dollar following the release of weak US inflation data, the Japanese yen has failed to strengthen significantly due to the persistent interest rate differential between the US and Japan.
Low actual CPI and PPI readings in the US dampened expectations of an imminent Federal Reserve rate hike, limiting the dollar’s gains. Meanwhile, the Bank of Japan continues to follow a more accommodative policy, so demand for the dollar against the yen remains high.
Market expectations have increased that Japan’s Ministry of Finance may carry out another unexpected intervention if the yen continues to weaken and the USDJPY rate reaches new highs.
The forecast for 16 July 2026 takes into account that the USDJPY rate may continue its upward trajectory, but two opposing factors are limiting the pair’s further movement: a weakening dollar following subdued US inflation and the yen’s continuing weakness.
Technical outlook
On the H4 chart, the USDJPY pair has formed a Hammer reversal pattern near the lower Bollinger Band and is trading around 162.10. Since the price remains within the ascending channel, it may continue its upward movement as the pattern’s signal plays out, with the upside target at 162.83.
At the same time, the USDJPY forecast also takes into account another possible market scenario, in which the USDJPY rate may form a corrective wave towards 161.65 before resuming growth.
USDJPY overview
- Asset: USDJPY
- Timeframe: H4 (Intraday)
- Trend: sideways with a moderately upward bias
- Key resistance levels: 162.55 and 162.83
- Key support levels: 161.65 and 161.15
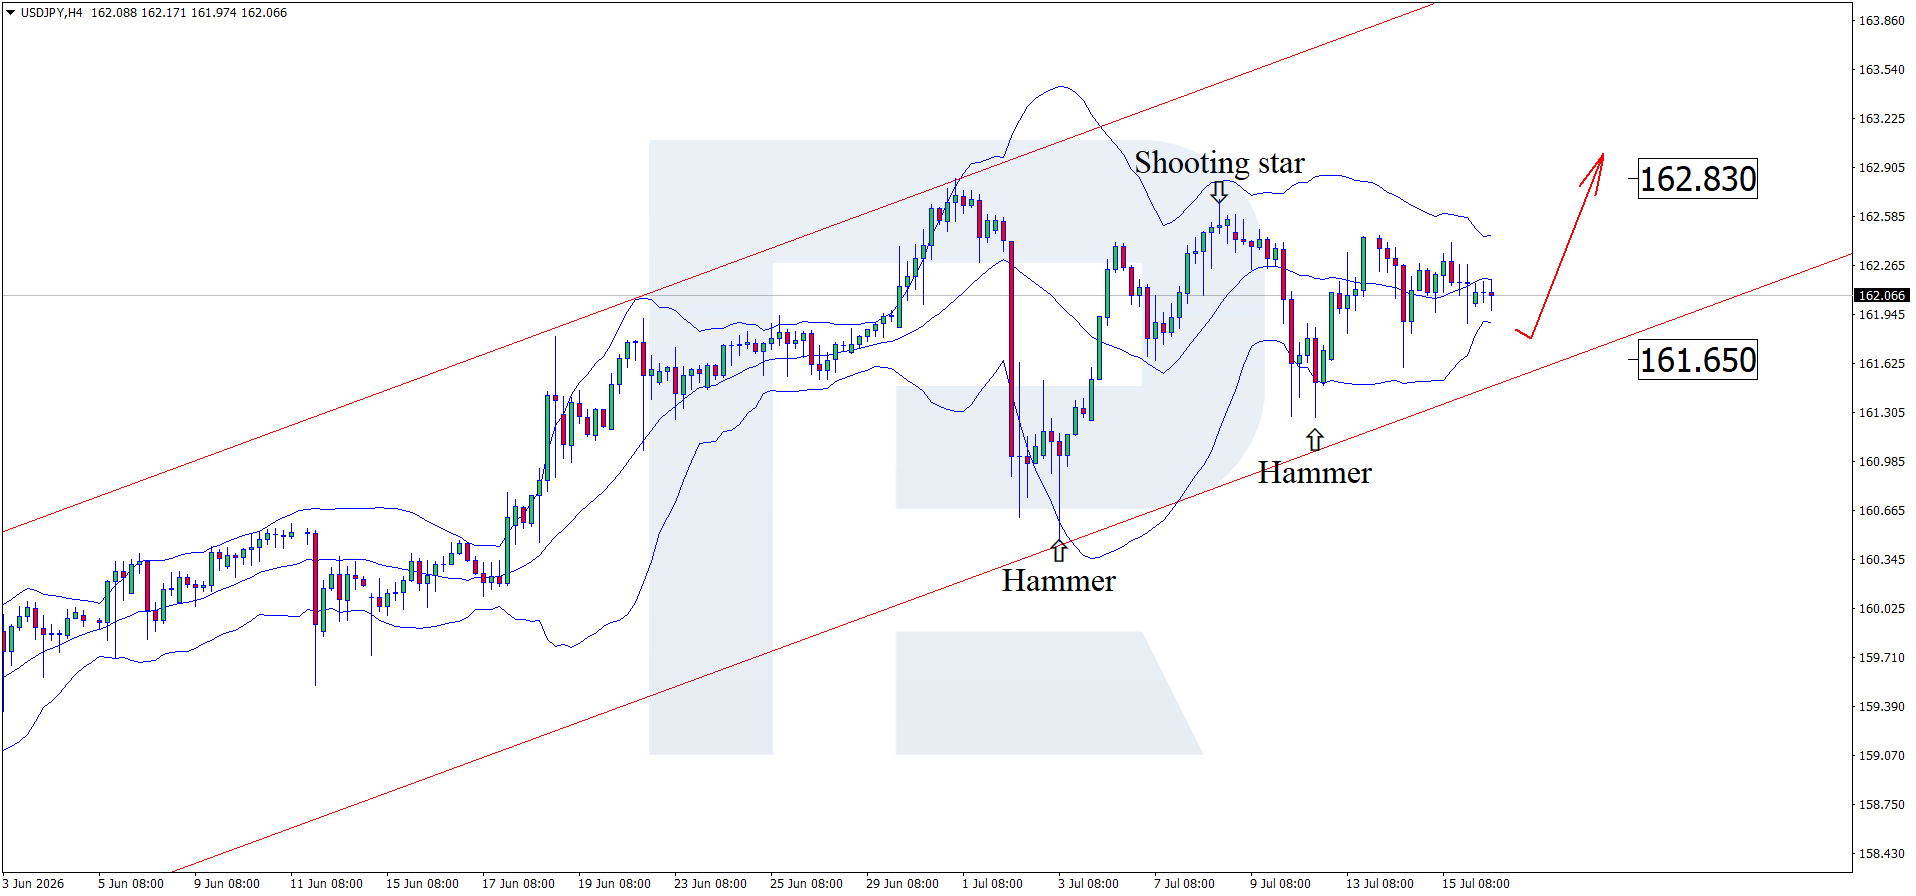
USDJPY trading scenarios for today
Main scenario (Buy Stop)
A breakout and consolidation above the 162.55 resistance level would confirm stronger buying pressure and open the way to the upper boundary of the range.
- Take Profit: 162.83
- Stop Loss: 162.40
Alternative scenario (Sell Stop)
Consolidation below the 161.65 support level would signal a downward move and increased demand for the Japanese yen.
- Take Profit: 161.15
- Stop Loss: 161.80
Risk factors
The main risk to the USDJPY growth scenario remains possible currency intervention by the Japanese authorities or more hawkish rhetoric from the Bank of Japan. Additional pressure on the pair may come from weak US data and a further decline in expectations of a Fed rate hike, which may support the yen and push the price back below 161.50.
Summary
The yen is awaiting action from the Japanese government and US data. USDJPY technical analysis suggests that quotes may rise towards 162.83 after a correction.
Editors’ picks

EURUSD forecast 2026–2027: technical analysis, price levels & predictions
EURUSD has pulled back from the 2026 high of 1.1915 and is now trading near 1.1450 — below both EMA65 and EMA200 — with the active scenario shifting from bullish to bearish. The ECB raised rates to 2.40%, but the Fed holds at 3.75%, and US inflation (3.5%) continues to outpace the eurozone (2.8%). A confirmed break below 1.1280 opens the next downward wave toward 1.1080. We break down the key levels, three trading scenarios with entry triggers, and what Deutsche Bank, Morgan Stanley and UBS are forecasting for EURUSD in 2026.

Gold (XAUUSD) forecast 2026: predictions based on fundamental and technical analysis
Gold has corrected over 25% from its all-time high of 5,597 USD and is now trading near 4,100 USD — testing a critical support zone. Is this the bottom, or will the downtrend continue? We break down the key levels (support 3,920 USD, breakout trigger 4,500 USD), three trading scenarios with entry levels, and what J.P. Morgan, Goldman Sachs and Deutsche Bank are forecasting for gold in 2026.
Ang mga pagtataya na ipinakita sa seksyong ito ay nagpapakita lamang ng pribadong opinyon ng may-akda at hindi dapat ituring bilang gabay para sa pagtetrade. Walang pananagutan ang RoboForex para sa mga resulta ng pagtetrade batay sa mga rekomendasyon sa pagtetrade na inilarawan sa mga analytical review na ito.