
USDJPY unstoppable: the yen keeps falling
The USDJPY pair starts the final week of July near 163.84. There is little that can really support the Japanese yen. For more details, see our analysis for 27 July 2026.
USDJPY forecast: key takeaways
- The USDJPY pair continues to rise, with factors working against the yen
- The Bank of Japan is likely to refrain from intervention for as long as possible
- USDJPY forecast for 27 July 2026: 163.55 or 164.10
Fundamental analysis
The USDJPY rate starts the week at 163.84. Rising oil prices and bond yields continue to support the pair, which is gradually reaching new four-decade highs. After a brief pause in May, the movement has again become almost one-sided, although the market is trying to prevent the rally from gaining momentum too quickly.
The fundamental backdrop for the yen has deteriorated again. Escalation in the Middle East means higher oil prices and additional costs for Japanese businesses. Cost-driven inflation complicates the Bank of Japan’s task, as the regulator must take into account not only wage growth but also a weak economy, high energy prices, and mounting fiscal risks.
Tokyo is therefore likely to rely on warnings for as long as possible. An actual intervention, quickly neutralised by market flows, would make subsequent measures less effective and weaken the credibility of the intervention threat itself.
As a result, the upward move in the USDJPY pair remains gradual, with fundamental factors working against the yen. The authorities may prefer not to intervene directly and instead rely on verbal pressure.
The USDJPY outlook is moderately positive.
Technical outlook
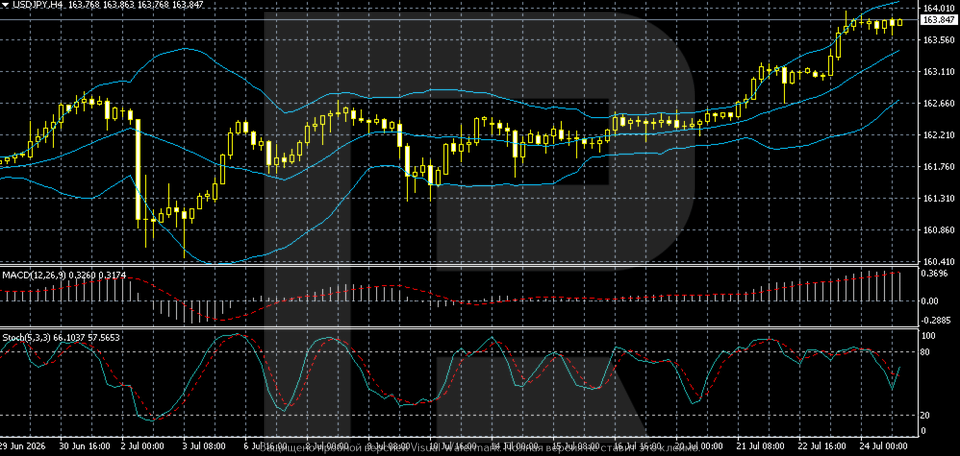
On the USDJPY H4 chart, the pair maintains a pronounced uptrend and is trading near 163.85, close to new multi-year highs. The price remains above the middle Bollinger Band and near the upper boundary of the indicator, confirming buyers’ advantage, although the pace of growth has temporarily slowed.
The nearest resistance is located in the 164.00–164.10 area. A firm breakout above it would allow the pair to continue towards new highs. Support levels are found at 163.55 and 163.10, while a deeper correction could take the pair towards the middle Bollinger Band near 162.65. As long as the price holds above 163.10, the bullish structure remains intact.
MACD is in positive territory and continues to rise, supporting the bullish scenario. The Stochastic Oscillator has turned upwards after a local decline and returned to neutral territory, leaving room for another attempt to break above 164.00. The baseline scenario remains consolidation within the 163.55–164.10 range with a positive bias.
USDJPY overview
- Asset: USDJPY
- Timeframe: H4 (intraday)
- Trend: bullish
- Key resistance levels: 164.10 and 164.55
- Key support levels: 163.55 and 163.10
USDJPY trading scenarios for today
Main scenario (Buy Stop)
A breakout and consolidation above the 164.10 resistance level would confirm continued upward momentum and create conditions for further USDJPY growth.
- Take Profit: 164.55
- Stop Loss: 163.85
Alternative scenario (Sell Stop)
A breakout and consolidation below the 163.55 support level would indicate a correction following the move to new multi-year highs.
- Take Profit: 163.10
- Stop Loss: 163.80
Risk factors
The main risk to the USDJPY upside scenario remains a possible currency intervention by the Japanese authorities. Additional pressure on the pair could come from heightened expectations of tighter Bank of Japan policy, lower oil prices, or falling US Treasury yields. As long as the price remains above 163.55, buyers retain the advantage.
Summary
The USDJPY pair continues to rise, with virtually no limits to its upward movement. The USDJPY forecast for today, 27 July 2026, suggests continued consolidation within the 163.55–164.10 range, with a gradual upward bias.
Editors’ picks

EURUSD forecast 2026–2027: technical analysis, price levels & predictions
EURUSD has pulled back from the 2026 high of 1.1915 and is now trading near 1.1450 — below both EMA65 and EMA200 — with the active scenario shifting from bullish to bearish. The ECB raised rates to 2.40%, but the Fed holds at 3.75%, and US inflation (3.5%) continues to outpace the eurozone (2.8%). A confirmed break below 1.1280 opens the next downward wave toward 1.1080. We break down the key levels, three trading scenarios with entry triggers, and what Deutsche Bank, Morgan Stanley and UBS are forecasting for EURUSD in 2026.

Gold (XAUUSD) forecast 2026: predictions based on fundamental and technical analysis
Gold has corrected over 25% from its all-time high of 5,597 USD and is now trading near 4,100 USD — testing a critical support zone. Is this the bottom, or will the downtrend continue? We break down the key levels (support 3,920 USD, breakout trigger 4,500 USD), three trading scenarios with entry levels, and what J.P. Morgan, Goldman Sachs and Deutsche Bank are forecasting for gold in 2026.
Ang mga pagtataya na ipinakita sa seksyong ito ay nagpapakita lamang ng pribadong opinyon ng may-akda at hindi dapat ituring bilang gabay para sa pagtetrade. Walang pananagutan ang RoboForex para sa mga resulta ng pagtetrade batay sa mga rekomendasyon sa pagtetrade na inilarawan sa mga analytical review na ito.